Executive Summary
Operation Epic Fury, initiated on February 28, 2026, represents a watershed moment in the evolution of modern warfare and global geopolitical strategy. The joint military campaign conducted by the United States and Israel was explicitly designed to preemptively dismantle the nuclear infrastructure, conventional military capabilities, and political leadership of the Islamic Republic of Iran. By the third week of March 2026, the coalition had achieved significant conventional military milestones. These milestones include the destruction of over 120 Iranian naval vessels, the elimination of approximately 90 percent of Iran’s land-based ballistic missile launch capacity, and the targeted killings of senior leadership figures such as the de facto regime leader Ali Larijani and Basij Commander Gholamreza Soleimani.1
However, the rapid destruction of Iran’s conventional deterrence did not yield the strategic capitulation anticipated by Western planners. Instead, it triggered a massive, decentralized, and highly lethal asymmetric escalation. Iran and its extensive proxy network immediately transformed the battlespace. They have leveraged cheap, easily produced unmanned aerial systems, mobile production facilities, and strategic chokepoint denial tactics to wage a prolonged war of attrition against technologically superior forces.4 The conflict has morphed into a complex theater dominated by the electromagnetic spectrum, defined by drone swarms, satellite intelligence sharing, and the rapid, unsustainable depletion of expensive Western precision munitions.6
For the People’s Republic of China and the Russian Federation, Operation Epic Fury serves as an unprecedented live-fire laboratory. Neither Beijing nor Moscow has intervened directly in the kinetic fight, yet both are extracting immense strategic and operational value from the conflict. The Russian Federation is actively utilizing the crisis to secure massive economic windfalls through surging global energy prices while simultaneously testing its electronic warfare and intelligence-sharing capabilities against active United States air defense systems in the Middle East.8 Concurrently, the People’s Republic of China is meticulously studying the limits of United States logistics, the rapid exhaustion of American munitions stockpiles, and the boundaries of Western political will. Beijing is directly applying these observations to its military doctrine and contingency planning for a future conflict over the island of Taiwan.10
This exhaustive research report provides a highly detailed situation report on the ongoing conflict. It focuses specifically on the top ten strategic, operational, and tactical advantages that China and Russia are extracting from the United States’ military engagement in Iran. These ten elements represent the core doctrinal lessons that will define the next decade of great power competition and fundamentally shape the architecture of future global conflicts.
1. Operational Theater Overview and Weekly Situation Report
The operational realities of Operation Epic Fury, alongside the Israeli component designated Operation Roaring Lion, have shattered several long-held Western military paradigms regarding deterrence and state collapse. The United States Central Command utilized overwhelming force in the opening phases of the conflict. The Pentagon deployed massive strike packages from the USS Gerald R. Ford and USS Abraham Lincoln carrier strike groups to deliver devastating combat power across the Iranian landmass.2 The operational tempo has been staggering, with the United States declaring air superiority by March 5, 2026, following the systematic destruction of Iranian radar and surface-to-air missile installations.13
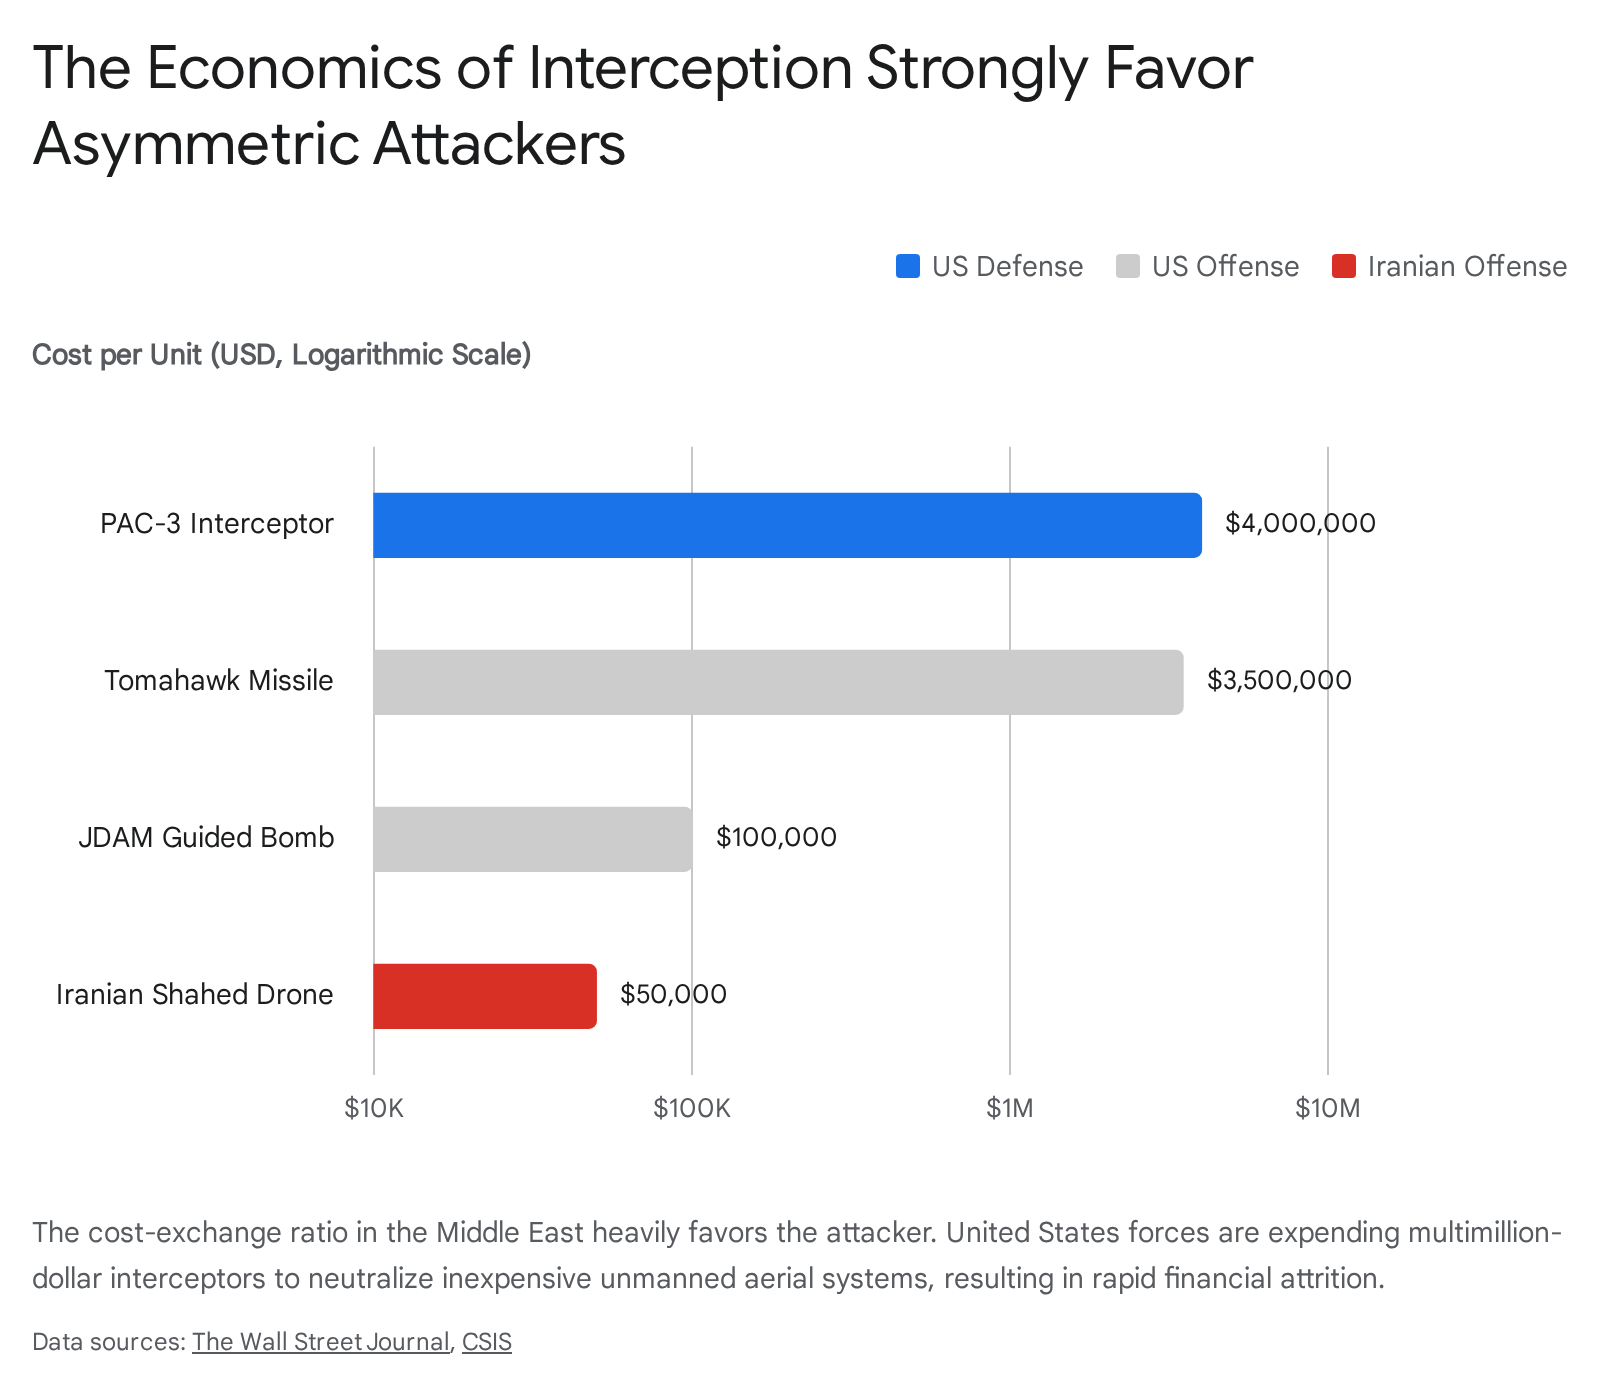
By the third week of the campaign, United States forces had struck over 7,800 targets across Iranian territory.13 These strikes focused heavily on command-and-control centers, air defense networks, and naval mine storage facilities. A notable operation occurred on Kharg Island, where United States precision strikes destroyed over 90 Iranian military targets, specifically targeting naval mine storage and missile bunkers while attempting to preserve the underlying civilian oil infrastructure.1 The Pentagon explicitly stated that the objective was to permanently eliminate the Iranian naval threat, ensure the destruction of the nation’s defense industrial base, and guarantee that Tehran never acquires a nuclear weapon.2 United States Secretary of War Pete Hegseth noted that Iranian ballistic missile and one-way drone attacks decreased by 90 percent since combat operations began, framing the campaign as a resounding conventional success.2
| Metric Category | Current Status as of March 2026 | Source Data |
| Total Targets Struck by US Forces | Over 7,800 targets across Iranian territory | 13 |
| Iranian Naval Vessels Destroyed | Over 120 vessels, including all 11 Iranian submarines | 2 |
| Reduction in Ballistic Missile Attacks | 90 percent reduction compared to pre-war baselines | 2 |
| Reduction in One-Way Drone Attacks | 95 percent reduction from Iranian domestic launch sites | 13 |
| United States Military Casualties | 13 fatalities, over 200 wounded across 7 regional countries | 13 |
Despite these overwhelming tactical successes, the strategic environment remains highly volatile and unconsolidated. The removal of Iran’s conventional deterrent incentivized the regime to fight asymmetrically and below the threshold of traditional state-on-state confrontation.4 Iranian forces and their regional proxies, including the Islamic Resistance in Iraq and Hezbollah in Lebanon, have sustained continuous attacks on United States bases, energy infrastructure, and maritime shipping lanes.1 Proxy attacks in Iraq have heavily targeted the United States Embassy in Baghdad and facilities near Baghdad International Airport using rockets and advanced drones.13
The human cost for the United States includes 13 service members killed. This figure includes seven soldiers killed by Iranian attacks in the opening days of the war and six Air Force crew members lost in a KC-135 Stratotanker refueling aircraft crash over Iraq on March 12, 2026.2 Furthermore, over 200 service members have been wounded or injured across seven different countries.13 In response to the strikes on its territory, Iran launched retaliatory ballistic missiles at United States bases in Bahrain, Qatar, Kuwait, and the United Arab Emirates, reportedly striking the Navy’s Fifth Fleet headquarters and causing civilian casualties in Abu Dhabi.4
2. The Economic and Financial Dimensions of Attrition
The financial burden of the campaign has become a central strategic vulnerability for the United States, a factor heavily scrutinized by foreign intelligence services. Briefings provided to the United States Senate in a closed-door session on March 11, 2026, indicated that the first six days of Operation Epic Fury cost American taxpayers at least 11.3 billion dollars.7 This extreme burn rate was driven primarily by the high-volume expenditure of high-end precision munitions deployed during the opening phase of strikes. Independent analysts at the Center for Strategic and International Studies estimated that the conflict had cost up to 16.5 billion dollars by its twelfth day alone.7
This financial attrition has forced the Department of War to prepare a massive 200 billion dollar supplemental funding request to sustain operations and replenish rapidly depleting stockpiles.14 Secretary of War Hegseth confirmed the department is seeking funding north of 200 billion dollars, noting that replenishing ammunition stockpiles is the primary challenge.14 This multibillion-dollar request faces significant legislative hurdles in the United States Congress, where lawmakers are demanding spending offsets and expressing concern over the lack of formal congressional authorization for the conflict.14
| Munition / Asset Type | Estimated Unit Cost (USD) | Strategic Application in Operation Epic Fury |
| PAC-3 Interceptor Missile | 4.0 million dollars | High-volume deployment for base defense against drones |
| Tomahawk Cruise Missile | 3.5 million dollars | precision strikes on hardened command and nuclear targets |
| JDAM Guided Bomb | 100,000 dollars | Deployed heavily after day four to reduce daily burn rates |
| Iranian Shahed Drone | 50,000 dollars | Deployed in massive swarms to saturate US radar systems |
This economic reality is fundamentally reshaping the operational approach. By the fourth day of the conflict, the United States military was forced to transition away from expensive cruise missiles toward cheaper munitions such as Joint Direct Attack Munition guided bombs, bringing the daily burn rate down to an estimated 500 million dollars.7 However, pre-war wargames conducted by the Pentagon demonstrated that the United States would run out of critical munitions only eight days into a high-intensity conflict with China over Taiwan. Analysts note that this timeline has now shrunk considerably due to the plunge into the Middle East.15 It is within this environment of high financial attrition, logistical strain, and asymmetric complexity that China and Russia are deriving their most critical long-term lessons.
3. Macro-Geopolitical Shifts and Diplomatic Realignments
Before examining the specific military advantages being studied by Beijing and Moscow, it is critical to contextualize the immediate geopolitical and economic shifts triggered by the conflict. Both revisionist powers are aggressively utilizing the chaos in the Persian Gulf to advance their respective grand strategies without committing kinetic forces to the theater.
The Russian Federation has emerged as the most immediate economic beneficiary of the conflict. The war has caused global oil prices to skyrocket, with Brent crude reaching 103 dollars per barrel.8 This price surge has provided Moscow with a massive revenue windfall, directly alleviating the economic pressures of its ongoing war in Ukraine and funding its domestic war economy.8 The threat to the Gulf’s energy infrastructure has made Russian oil and gas temporarily indispensable to global markets. This dynamic forced the United States Treasury to issue a one-month waiver on sanctions for Russian crude currently on tankers to prevent a complete collapse of global energy supply.8 Experts warn this move severely reduces the stigma of buying Russian oil and risks permanently dismantling the sanctions regime built to pressure Moscow.8 Additionally, Russia is using the conflict to push China toward committing to the construction of overland pipelines from Russia, reducing Beijing’s reliance on vulnerable Middle Eastern sea lines of communication.8
The People’s Republic of China has adopted a stance of calculated diplomatic neutrality, positioning itself as an objective peacemaker while capitalizing on the geopolitical fallout. Beijing has publicly called for an immediate ceasefire and warned of the severe impacts on global trade, shipping, and energy.17 By maintaining this diplomatic posture, China is deepening its relationships with the Global South and the Organization of Islamic Cooperation. Chinese Vice President and Foreign Minister Wang Yi held high-level talks with the Secretary-General of the 57-nation OIC to discuss regional security, drawing a stark contrast between Beijing’s diplomatic approach and the kinetic actions of the United States.17 Economically, China is securing unexpected victories in currency internationalization. Due to the geopolitical instability and shifting minerals markets, nations such as India have been forced to settle trades with Russia using the Chinese Yuan, accelerating the de-dollarization of the global economy and handing Beijing a massive structural victory.17
4. Top 10 Strategic and Tactical Advantages for China and Russia
The following ten elements represent the most critical lessons and advantages that China and Russia are deriving from the United States’ conflict with Iran. Each point details the specific operational reality observed in the Iranian theater and explains precisely why it provides a decisive advantage to Beijing or Moscow in a future confrontation with Western forces.
4.1. Advantage 1: Exploitation of Adversary Munitions Depletion Rates
The Operational Reality: The United States military is demonstrating an unsustainable burn rate of precision-guided munitions and high-end interceptors. During the opening phase of Operation Epic Fury, the United States relied heavily on Tomahawk cruise missiles and Patriot Advanced Capability-3 interceptors.7 The cost asymmetry is severe. The United States is utilizing interceptors costing 4.0 million dollars each to neutralize Iranian one-way attack drones that cost tens of thousands of dollars to manufacture.7 This rapid depletion of high-end munitions has forced the Pentagon to request 200 billion dollars from Congress simply to refill stockpiles.14 Pentagon wargames had already established that the United States lacked the magazine depth for a sustained conflict, and the current operational tempo in Iran is drastically accelerating the depletion of the global United States weapons inventory.15
The Strategic Advantage for China and Russia: For the People’s Liberation Army, the depletion of American munitions is the single most critical data point for a Taiwan invasion scenario. The Chinese military command recognizes that if the United States exhausts its inventory of long-range anti-ship missiles and advanced air defense interceptors in the Middle East, its ability to project power into the Indo-Pacific will be critically compromised. The PLA is learning that forcing the United States into a prolonged, geographically distant war of attrition is a highly viable strategy to strip Washington of its high-tech magazine depth. For Russia, the advantage is immediate and tangible. Every PAC-3 interceptor fired at an Iranian drone over the Persian Gulf is an interceptor that cannot be deployed to support Ukraine or fortify Eastern European NATO allies. Moscow is observing that the United States defense industrial base lacks the elasticity to simultaneously supply multiple high-intensity theaters. This observation validates Russia’s overarching strategy of outlasting Western material support and weaponizing the limitations of capitalist defense production models.
4.2. Advantage 2: The Economics of Air Defense Saturation and Swarm Tactics
The Operational Reality: Iran has fundamentally shifted its strategy from calibrated, proportional retaliation to unbridled escalation, utilizing massive swarms of cheap, easily manufactured drones as the primary mechanism for attack.5 These drones act as the improvised explosive devices of the modern aerospace domain. They are capable of causing significant disruption to base operations and civilian infrastructure at an incredibly low cost. The Iranian strategy relies entirely on volume. By launching hundreds of drones simultaneously alongside cruise and ballistic missiles, Iran aims to saturate and overwhelm the radar tracking systems and interceptor capacities of United States Aegis combat systems and Patriot batteries.13 The Gulf states, which historically spend tens of billions of dollars annually on advanced Western air defense networks, are now seeking emergency assistance and cheap counter-drone technologies from Ukraine. They have realized that defending airspace using traditional methods is a path to systemic failure.18
The Strategic Advantage for China and Russia: This phenomenon comprehensively validates and refines the core military doctrines of both revisionist nations. For Russia, the conflict confirms the efficacy of the saturation tactics it has pioneered and employed in Ukraine. Furthermore, Russia is gaining invaluable real-time telemetry on how United States systems handle complex, multi-vector saturation attacks. This data allows Russian aerospace engineers to adjust the flight algorithms of their own munitions to better evade Western radar logic in the future.8 For China, the PLA Rocket Force is structurally built upon the premise of overwhelming enemy defenses through sheer volume. The Iranian operational template proves that even the most advanced Western air and missile defense shields can be cracked if the attacker possesses sufficient mass and willingness to accept high interception rates. China is observing the exact mathematical threshold at which American tracking systems become overloaded, providing vital calibration data for a potential missile barrage against Taiwan or United States military installations in Guam and Okinawa.
4.3. Advantage 3: Electromagnetic Spectrum and Space-Based Targeting Integration
The Operational Reality: The conflict in the Persian Gulf is not defined by traditional front lines or massive armor formations, but rather by absolute control over the electromagnetic spectrum. It is a war fought with radar beams, satellite feeds, and encrypted targeting coordinates.6 To aid Iranian forces, Russia has reportedly provided highly sensitive intelligence. This intelligence includes the precise satellite locations of United States warships and aircraft operating across the Middle East.6 This intelligence sharing allows Iranian coastal missile batteries and drone operators to target mobile United States maritime assets with significantly higher accuracy than their indigenous sensors would permit.
The Strategic Advantage for China and Russia: The integration of space-based assets into regional conflicts serves as a massive force multiplier. For Russia, providing satellite data to Iran serves two distinct purposes. First, it exacts a severe kinetic cost on the United States military, acting as retribution for Washington’s support of Ukraine. Second, it allows Russia to test the latency, security, and accuracy of its own space-to-ground intelligence sharing architecture in a live combat scenario against top-tier American naval assets.8 For China, the conflict is serving as an invaluable live-fire laboratory.6 Beijing is not politically or ideologically motivated to arm Tehran, but it recognizes the scientific value of the conflict. Every single time an Iranian coastal missile engages a United States carrier strike group, the engagement generates vast amounts of targeting, radar reflection, and intercept data.6 Chinese military planners will study this data exhaustively to refine their own radar architectures and doctrine. This data is critical for programming the targeting sensors of weapons like the CM-302 anti-ship cruise missile, which China intends to deploy in the South China Sea.6 By watching Iran fight, China learns precisely how to blind and strike the United States Navy without risking a single PLA vessel.
4.4. Advantage 4: Survivability through Decentralized Proxy Networks
The Operational Reality: Operation Epic Fury successfully destroyed much of Iran’s conventional military infrastructure within its borders, yet it completely failed to neutralize the state’s capacity to project power across the region. This strategic failure occurred because Iran’s true center of gravity is not its domestic military bases, but its decentralized, heavily armed network of proxy militias across the Middle East.4 Groups such as the Houthis in Yemen, Hezbollah in Lebanon, and the Islamic Resistance in Iraq possess independent command structures, dispersed weapons caches, and localized supply chains.4 When the United States executed decapitation strikes against the Iranian leadership, it produced a network with every incentive to fight asymmetrically and indefinitely. In a single 24-hour period, Iraqi militias claimed 27 separate attacks against United States personnel and offered financial rewards for targeting American logistics.1
The Strategic Advantage for China and Russia: The resilience of the Iranian proxy network provides a masterclass in asymmetric deterrence and sub-state warfare. Russia has already utilized similar concepts through private military companies and proxy separatist forces in Eastern Europe and the African continent. The Iranian model proves conclusively that a state sponsor can suffer catastrophic kinetic damage at home while its external networks continue to inflict severe strategic pain on the adversary. For China, this demonstrates the immense strategic value of cultivating asymmetric, non-state leverage points. If China were to face severe economic blockades or kinetic strikes in a future conflict, having a dispersed network of aligned, semi-autonomous actors capable of disrupting global shipping lanes or attacking adversary bases in secondary theaters would ensure that the cost of conflict remains unacceptably high for Western nations.
4.5. Advantage 5: Asymmetric Maritime Denial in Strategic Chokepoints
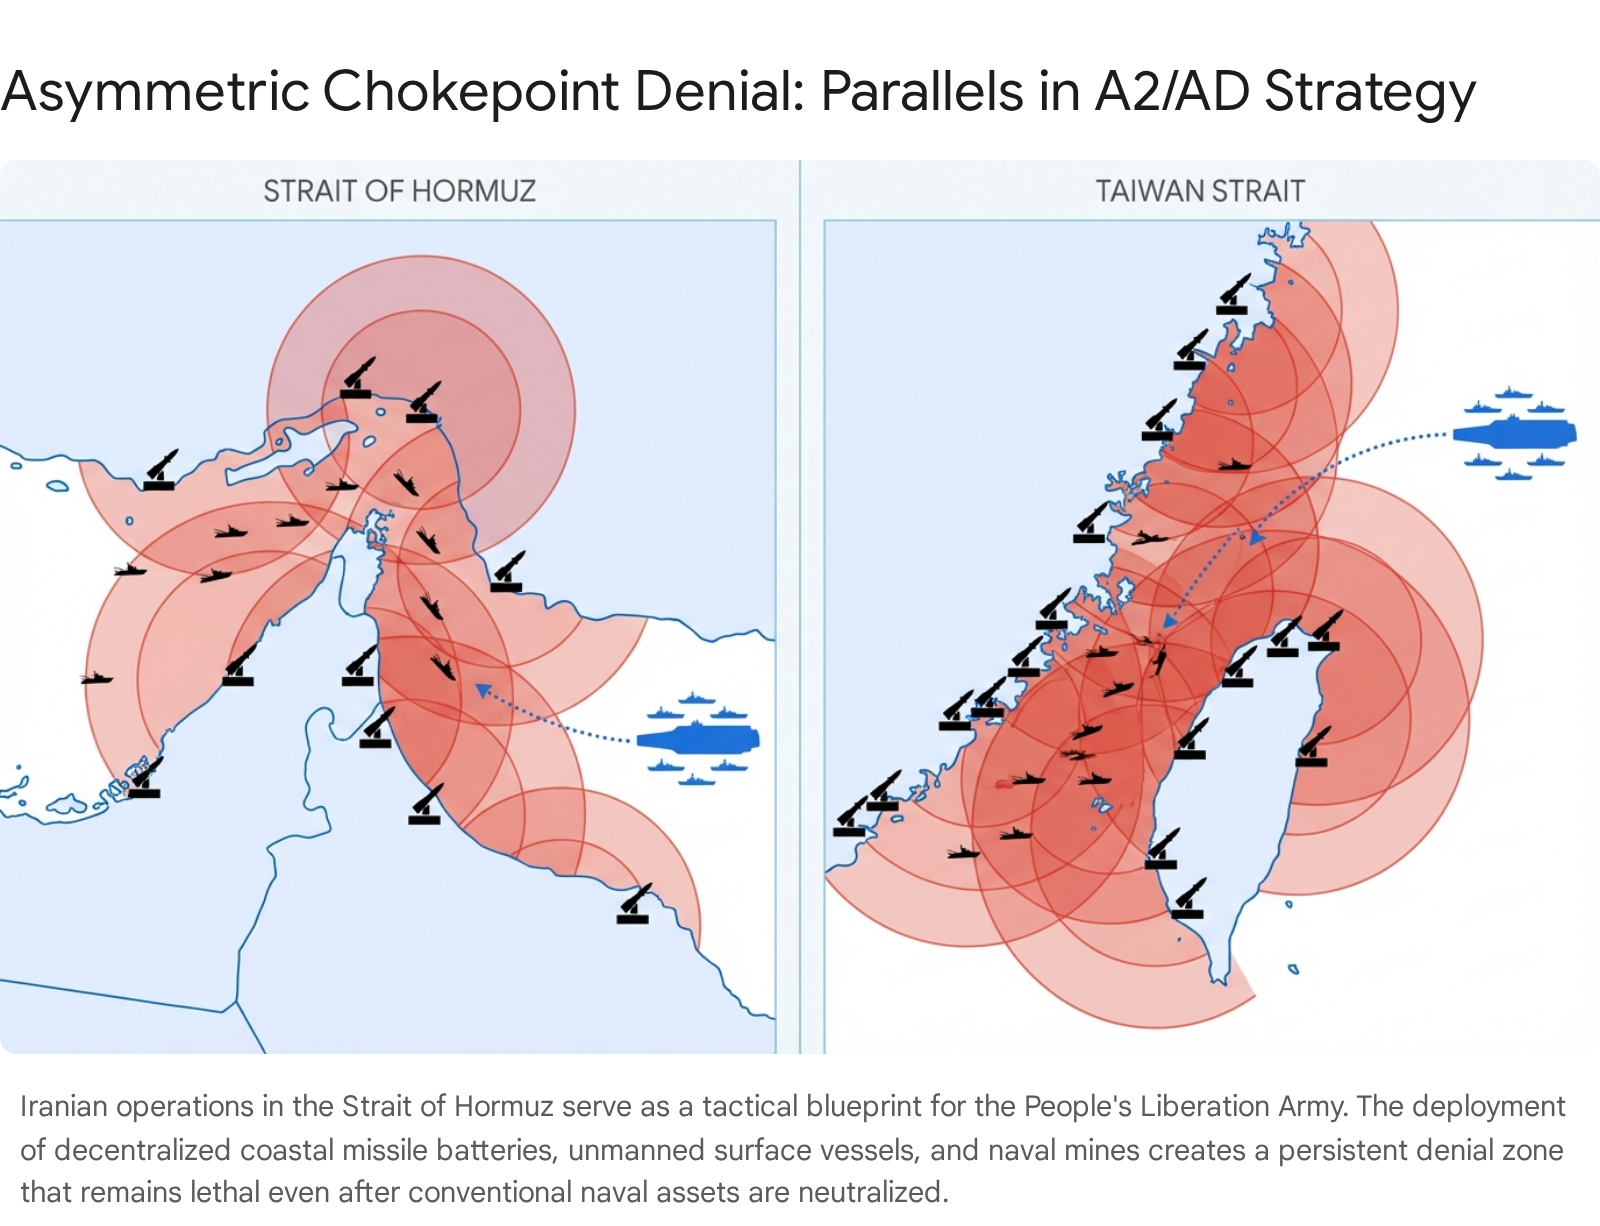
The Operational Reality: Despite the United States Navy destroying over 120 Iranian vessels, including all 11 of their submarines, Iran continues to dictate the security architecture of the Strait of Hormuz.2 The Islamic Revolutionary Guard Corps Navy relies heavily on unconventional tactics. They utilize massive swarms of fast attack boats, unmanned surface vessels, deployable sea mines, and hidden coastal missile batteries.10 IRGC Navy Commander Alireza Tangsiri has implicitly threatened to attack all unauthorized maritime transit through the strait, leading to dozens of maritime incidents.9 Eran Ortal, an Israeli military strategist, noted that this dynamic defines the nature of asymmetric warfare. Even if the conventional fleet is entirely sunk, the asymmetric capabilities remain entrenched along the coastline, functioning like highly lethal anti-tank snipers against commercial shipping.10 The United States strategy to counter this involves deploying Marine Expeditionary Units on amphibious ships, utilizing stealthy F-35 Lightnings and Cobra rotary-wing gunships to hunt small boats and protect vulnerable tankers.19
The Strategic Advantage for China and Russia: The geopolitical and tactical parallels between the Strait of Hormuz and the Taiwan Strait are direct and profound. Chinese military analysts from the PLA National Defense University are closely monitoring how a technologically inferior force can effectively close a vital maritime chokepoint against the world’s premier blue-water navy.11 China is taking extensive notes on the specific countermeasures deployed by the United States. By observing the tactics the United States Marine Corps and Navy employ to clear the Strait of Hormuz, the PLA can engineer specific counter-tactics. These may include the development of advanced sea-skimming autonomous drones, massive automated minefields, and hyper-dense coastal missile networks designed to ensure that the United States cannot utilize similar clearance methods in the Western Pacific or the Strait of Malacca during a Taiwan contingency.
4.6. Advantage 6: Deeply Layered Command and Control Resilience
The Operational Reality: Operation Epic Fury featured a massive decapitation campaign aimed at collapsing the Iranian government and security apparatus. United States and Israeli strikes successfully targeted and killed Supreme Leader Ayatollah Ali Khamenei in the early stages of the war, shifting power to his son, Mojtaba Khamenei.3 Subsequent waves of targeted killings eliminated Ali Larijani, the Secretary of the Supreme National Security Council and the de facto leader of the regime, as well as Gholamreza Soleimani, the commander of the Basij forces.3 Despite the systematic elimination of the political and security apex, the Iranian state did not collapse into widespread chaos or civil war. United States intelligence assessed that the Islamic Revolutionary Guard Corps effectively absorbed the shock and assumed total command, calling the shots and maintaining operational continuity across the theater.21 The resilience of the state is underpinned by a deeply layered system of governance and a powerful, ideologically charged security apparatus that functions independently of individual leaders.22
The Strategic Advantage for China and Russia: The concept of regime survival under catastrophic decapitation strikes is of paramount interest to autocratic political systems. Russian intelligence analysts have explicitly noted that rapidly destabilizing an ideologically charged state system through decapitation strikes or economic pressure is exceedingly difficult.22 For President Vladimir Putin, the Iranian survival provides assurance that highly centralized security structures, such as the Federal Security Service and the Russian military command, can maintain national cohesion even if top leadership is neutralized by Western precision weapons. For the Chinese Communist Party, the survival of the IRGC validates the absolute necessity of embedding party control, political commissars, and ideological discipline deeply within the military structure. The PLA is learning that maintaining a redundant, deeply integrated command network ensures that the military can sustain operations and maintain internal security even in the event of devastating precision strikes against Beijing’s political elite.
4.7. Advantage 7: Energy Market Weaponization and Sanctions Evasion
The Operational Reality: The conflict has unequivocally demonstrated the extreme fragility of the global energy market and the effectiveness of weaponizing energy supply chains as a tool of war. Iranian officials explicitly threatened that if its energy facilities on Kharg Island were attacked, it would destroy the energy infrastructure of neighboring allied countries and close the Strait of Hormuz to hostile tankers.1 This threat alone sent massive shockwaves through global commodities markets. Russia immediately capitalized on this volatility. By offering itself as a stable, alternative energy provider amidst Middle Eastern chaos, Russia entrenched its role as an indispensable global energy supplier. This dynamic fundamentally weakened the political will of Western nations to enforce energy sanctions related to the Ukraine war, resulting in immediate financial relief for Moscow.8 Furthermore, the geopolitical risk prompted China to halt exports of refined oil products, signaling growing trepidation about maritime supply disruptions and prioritizing domestic reserves.23
The Strategic Advantage for China and Russia: This dynamic exposes a critical vulnerability in the Western strategic posture. For Russia, the advantage is the realization that global economic stability is highly sensitive to regional chokepoints. Moscow is learning that by subtly stoking instability in regions critical to the global supply chain, it can fracture Western political consensus on sanctions and generate immediate financial windfalls to fund its military industrial complex. For China, the lesson is distinctly defensive. The conflict underscores the severe strategic risk of relying on maritime imports traversing contested straits guarded by the United States Navy. This operational reality reinforces Beijing’s strategic imperative to rapidly expand overland energy pipelines connecting directly to Russia and Central Asian republics.8 By building infrastructure immune to United States naval blockades, China guarantees its energy security for a future confrontation over Taiwan.
4.8. Advantage 8: Proliferation and Employment of Fiber-Optic FPV Drones
The Operational Reality: A significant and highly dangerous tactical evolution observed in the conflict is the introduction of First-Person View drones by Iranian proxy groups. Open-source intelligence analysis and drone footage posted by the Iraqi militia group Saraya Awliya al Dam revealed the active use of fiber optic FPV drones against United States installations.9 These drones represent a nascent but highly lethal capability that challenges traditional base defense paradigms. Unlike traditional GPS-guided munitions, which can be disrupted by electronic warfare and radio frequency jamming, fiber optic FPV drones are entirely immune to standard jamming techniques because their control signal travels through a physical wire unspooled during flight. They allow proxy operators to conduct complex, real-time reconnaissance and highly coordinated precision strikes intended to overwhelm point defenses and target vulnerable personnel or sensitive equipment.13
The Strategic Advantage for China and Russia: The battlefield application of FPV drones is completely rewriting tactical infantry and armor operations globally. Russia is intimately familiar with FPV technology from its operations in Ukraine. However, observing Iranian proxies successfully utilize these systems against highly defended United States bases provides a new layer of tactical validation. It proves that non-state actors can achieve precision strike capabilities previously reserved for advanced militaries with complex targeting pods. For China, the rapid proliferation of FPV technology is a dual-edged sword. While it poses a threat to standard infantry, the PLA is undoubtedly analyzing how massive swarms of autonomous or semi-autonomous FPV drones could be deployed during an amphibious assault. The ability to field unjammable, highly maneuverable loitering munitions provides a significant tactical advantage in clearing complex urban terrain or striking fortified coastal defenses in Taiwan, negating the island’s electronic warfare countermeasures.
4.9. Advantage 9: Mobile and Decentralized Defense Industrial Production
The Operational Reality: A core objective of the United States campaign was the total destruction of Iran’s defense industrial base, particularly its ballistic missile and drone manufacturing capabilities.2 United States Secretary of War Pete Hegseth claimed that this objective was nearing complete destruction in mid-March.2 However, strategic analysts noted that while large, static production facilities may be destroyed by precision bombs, Iran’s actual production capabilities are remarkably resilient. Drones are relatively cheap, easy to manufacture, and can be assembled in mobile manufacturing facilities spread across the country or hidden deeply underground.5 This extreme decentralization makes it virtually impossible to completely neutralize the adversary’s ability to generate new combat power from the air, guaranteeing a prolonged conflict characterized by constant harassment strikes.5
The Strategic Advantage for China and Russia: The survival of a defense industrial base under constant, overwhelming aerial bombardment is a critical metric for long-term strategic planning. Russia has already adapted its industrial base by moving critical production facilities beyond the range of Ukrainian strike weapons and distributing manufacturing across multiple sectors. The Iranian example reinforces the necessity of this geographic and structural dispersion. For China, the lesson is profound. While China possesses the world’s largest industrial capacity, much of it is concentrated in dense coastal cities vulnerable to United States long-range precision fires. Observing the United States struggle to eradicate Iranian drone production validates the PLA’s strategy of Civil-Military Fusion. It highlights the necessity of maintaining deeply buried, highly distributed manufacturing hubs in the interior provinces to ensure the uninterrupted production of autonomous systems and guided munitions during a major war with the United States.
4.10. Advantage 10: Information Warfare and Diplomatic Alienation of the West
The Operational Reality: As Operation Epic Fury evolves into a high-cost war of attrition with mounting civilian and infrastructure damage, domestic and international skepticism regarding the United States’ decision-making has rapidly intensified. The conflict is increasingly viewed globally as a strategic disaster born of political miscalculation.24 China has masterfully exploited this sentiment in the global information space. Beijing has flooded social media and international news networks with narratives emphasizing the cruelty of the United States military coalition, utilizing sophisticated AI-generated content to amplify critiques of American hegemonic intervention.24 Concurrently, China’s official diplomatic corps presents the nation as a responsible, objective global power seeking non-interference and peace. Observers note that while an American kinetic triumph remains elusive, the severe erosion of Washington’s diplomatic credibility renders the United States the ultimate strategic victim of this conflict.24
The Strategic Advantage for China and Russia: The battle for global narrative dominance is a primary theater in contemporary great power competition. For Russia, portraying the United States as a reckless aggressor in the Middle East deflects international attention and moral condemnation away from its own actions in Eastern Europe. Russian Foreign Minister Sergey Lavrov actively frames the United States actions as a severe blow to global arms control and regional stability.8 For China, the advantage is systemic and structural. By painting the United States as a destabilizing force prone to military adventurism, Beijing strengthens its appeal to the Global South. It allows China to position its Belt and Road Initiative and its models of economic partnership as safe, stable alternatives to the volatile security umbrella offered by Washington. The conflict accelerates the fracturing of the United States-led international order, allowing China to reshape global governance structures and isolate Taiwan diplomatically without firing a single shot.
5. Strategic Forecast and Conclusion
The joint United States and Israeli campaign against the Islamic Republic of Iran, while achieving significant tactical destruction of conventional military assets, has inadvertently provided the world’s revisionist powers with a comprehensive blueprint for modern asymmetric warfare. Operation Epic Fury demonstrates conclusively that overwhelming kinetic dominance and control of the airspace are insufficient to secure rapid strategic victory when an adversary possesses resilient proxy networks, decentralized production capabilities, and a willingness to weaponize global economic chokepoints.
For the Russian Federation, the conflict offers immediate tactical intelligence on United States air defense systems, vital economic relief through surging global energy markets, and a crucial geopolitical distraction that depletes Western munitions stockpiles originally intended for the European theater. Moscow is learning that the United States defense industrial base is highly vulnerable to concurrent global crises, lacking the elasticity required for multi-theater hegemony.
For the People’s Republic of China, the Gulf conflict serves as a surrogate war game for a future Taiwan contingency. The PLA is exhaustively analyzing the rate at which the United States depletes its precision munitions, the economic breaking point of American air defense systems against low-cost drone swarms, and the specific tactical methods employed by the Marine Corps to secure contested maritime straits. Furthermore, Beijing is capitalizing on the geopolitical fallout to isolate the United States diplomatically, accelerating the transition toward a multipolar world order dominated by economic pragmatism rather than Western security guarantees.
Ultimately, China and Russia are extracting a singular, defining lesson from the ashes of Operation Epic Fury. The future of global warfare does not strictly belong to the nation fielding the most expensive naval platforms or stealth aircraft. Rather, victory will favor the actor who can most effectively leverage asymmetry, sustain industrial capacity under intense bombardment, and seamlessly integrate operations across the electromagnetic, physical, and informational domains.
Please share the link on Facebook, Forums, with colleagues, etc. Your support is much appreciated and if you have any feedback, please email us in**@*********ps.com. If you’d like to request a report or order a reprint, please click here for the corresponding page to open in new tab.
Sources Used
- Operation “Epic Fury:” SITREP (15 MAR 2026), accessed March 21, 2026, https://ict.org.il/operation-epic-fury-sitrep-15-mar-2026/
- This Week in DOW: U.S. Delivers ‘Devastating Combat Power’ to Iran, accessed March 21, 2026, https://www.war.gov/News/News-Stories/Article/Article/4440215/this-week-in-dow-us-delivers-devastating-combat-power-to-iran/
- Operation “Epic Fury:” SITREP (17 MAR 2026) – ICT, accessed March 21, 2026, https://ict.org.il/operation-epic-fury-sitrep-17-mar-2026-2/
- We Bombed the Wrong Target Iran’s Proxy Network Strategy – Irregular Warfare Initiative, accessed March 21, 2026, https://irregularwarfare.org/articles/iran-proxy-network-strategy/
- Iran’s War Strategy: Don’t Calibrate—Escalate – CSIS, accessed March 21, 2026, https://www.csis.org/analysis/irans-war-strategy-dont-calibrate-escalate
- The war of signals: How Russia and China help Iran see the battlefield – Al Jazeera, accessed March 21, 2026, https://www.aljazeera.com/opinions/2026/3/12/the-war-of-signals-how-russia-and-china-help-iran-see-the-battlefield
- Pentagon Requests More Than £158 Billion For Expanding Iran War Effort As White House Aides Doubt Congress Approval, accessed March 21, 2026, https://www.ibtimes.co.uk/pentagon-200-billion-request-operation-epic-fury-1786771
- Russia Analytical Report, March 9–16, 2026 | Russia Matters, accessed March 21, 2026, https://www.russiamatters.org/news/russia-analytical-report/russia-analytical-report-march-9-16-2026
- Iran Update Special Report, March 17, 2026 – Institute for the Study of War, accessed March 21, 2026, https://understandingwar.org/research/middle-east/iran-update-special-report-march-17-2026/
- Interview: Iran’s Use Of Chinese Doctrine And Tech Under The Spotlight, accessed March 21, 2026, https://www.rferl.org/a/iran-war-chinese-doctrine-tech-ortal-idf-israel/33707130.html
- Crossing the Strait: China’s Military Prepares for War with Taiwan – NDU Press, accessed March 21, 2026, https://ndupress.ndu.edu/Other-Publications/Books/Crossing-the-Strait/
- Colorado Congresswoman Lauren Boebert against funding for war in Iran: “We need America First policies right now”, accessed March 21, 2026, https://www.cbsnews.com/colorado/news/colorado-congresswoman-lauren-boebert-additional-funding-iran-war/
- Analysis: Operational gains against Iran continue, but threats to US …, accessed March 21, 2026, https://www.longwarjournal.org/archives/2026/03/analysis-operational-gains-against-iran-continue-but-threats-to-us-forces-persist.php
- Pentagon seeks at least $200B from Congress for Iran war, accessed March 21, 2026, https://www.wfmd.com/2026/03/19/pentagon-seeks-at-least-200b-from-congress-for-iran-war/
- Asymmetric War in Iran: How Trump and the U.S. Are Being Played, accessed March 21, 2026, https://washingtonmonthly.com/2026/03/19/asymmetric-drone-war-in-iran-how-trump-and-the-u-s-are-being-played/
- Russia and China: Gaining from the war with Iran? | State of Play – YouTube, accessed March 21, 2026, https://www.youtube.com/watch?v=_1vVF15YoM0
- China Warns Middle East War Threatens Global Trade, accessed March 21, 2026, https://chinaglobalsouth.com/2026/03/20/china-warns-middle-east-war-global-trade-impact/
- Countries turn to Ukraine for help as Iran shows up their outdated air defenses, accessed March 21, 2026, https://euromaidanpress.com/2026/03/13/countries-turn-to-ukraine-for-help-as-iran-shows-up-their-outdated-air-defenses/
- FPRI Experts React | Options in the Strait of Hormuz – Foreign Policy Research Institute, accessed March 21, 2026, https://www.fpri.org/article/2026/03/fpri-experts-react-options-in-the-strait-of-hormuz/
- National Defense University Press > Publications > Books > The PLA and Contingency Planning in China, accessed March 21, 2026, https://ndupress.ndu.edu/Publications/Books/The-PLA-and-Contingency-Planning-in-China/
- Iran Update Special Report, March 15, 2026 – Institute for the Study of War, accessed March 21, 2026, https://understandingwar.org/research/middle-east/iran-update-evening-special-report-march-15-2026/
- Russia Analytical Report, Feb. 17–23, 2026, accessed March 21, 2026, https://www.russiamatters.org/news/russia-analytical-report/russia-analytical-report-feb-17-23-2026
- China-Iran Fact Sheet: A Short Primer on the Relationship | U.S., accessed March 21, 2026, https://www.uscc.gov/research/china-iran-fact-sheet-short-primer-relationship
- The Message it sends to China – 想想Thinking Taiwan – 想想台灣,想想未來, accessed March 21, 2026, https://www.thinkingtaiwan.net/article/100209
- “Enemy within”: How Chinese analysts view the US-Iran war, accessed March 21, 2026, https://pacforum.org/publications/the-pilot-14-enemy-within-how-chinese-analysts-view-the-us-iran-war/