1. Executive Overview and Geopolitical Context
The outbreak of the third Gulf War on February 28, 2026, initiated by joint United States and Israeli military operations under the designation Operation Epic Fury, has fundamentally altered the global economic and security landscape.1 The opening salvos targeted and eliminated key Iranian leadership figures, including Supreme Leader Ali Khamenei, which triggered a massive retaliatory wave of Iranian ballistic missiles and drone strikes across the Middle East.1 These retaliatory strikes have engaged military installations and deeply compromised civilian infrastructure, energy hubs, and commercial maritime routes across the Gulf Cooperation Council states, including the United Arab Emirates, Bahrain, Qatar, Kuwait, and Saudi Arabia.3
The defining geoeconomic consequence of the conflict thus far is the de facto closure of the Strait of Hormuz. While Iranian naval assets in the Gulf of Oman have suffered significant degradation from United States Central Command operations, the combination of kinetic drone strikes, elevated war risk insurance premiums, and massive electronic warfare operations has brought commercial transit to a virtual standstill.5 By early March 2026, maritime traffic through the Strait had plummeted by nearly 80 percent, with daily transits dropping from an average of 153 to as few as three per day.6 Advanced tracking indicates that automatic identification system signals are being heavily jammed or spoofed, causing vessels to cluster in holding patterns near Fujairah and the Gulf of Oman to avoid collision and missile threats.6
Foreign affairs and national security analysts observe that the crisis extends far beyond a bilateral military exchange. The conflict has exposed a fragmenting regional order where global powers are maneuvering for leverage. Intelligence reports suggest that Russia is sharing intelligence with Iran to support strikes against United States forces, highlighting a deepening cooperation between adversaries.8 Simultaneously, China is reportedly negotiating directly with Tehran for safe passage of its tankers through the closed strait, underscoring Beijing’s deep reliance on Middle Eastern energy.9 Inside Iran, the assassination of leadership has led to a succession crisis and the establishment of a ruling triumvirate, further complicating diplomatic off ramps.10
The resulting supply chain shock is unprecedented in its speed and scope. The Middle East remains the heart of the global energy and petrochemical system. The constriction of the Strait of Hormuz directly threatens 20 percent of the world’s daily oil supply, large segments of global liquefied natural gas exports, and massive portions of the global fertilizer and petrochemical trades.11 Consequently, global commodity markets have entered a state of extreme volatility. Energy, agricultural inputs, and industrial metals are experiencing sharp price spikes as buyers scramble to secure alternative sources.12 This report details the extent of the supply chain shocks across the top 10 most directly impacted industries, identifies regions with the capacity to absorb the displaced demand, and forecasts the timeframes required for alternative capacities to come online.
2. Macroeconomic Shifts and Systemic Trade Ruptures
The current conflict represents a structural geoeconomic rupture rather than a temporary logistical hurdle. The disruption of the Persian Gulf activates severe inflationary pressures across global supply chains. Economic analysis indicates that for energy importing powerhouses such as China and India, the sudden loss of Middle Eastern crude, liquefied natural gas, and chemical feedstocks drives up production costs for energy intensive manufacturing sectors.11 This input inflation squeezes profit margins and threatens global export competitiveness.11
Furthermore, the conflict has exposed the limitations of regional air defense architecture. While Gulf Cooperation Council states utilizing United States supplied Terminal High Altitude Area Defense systems and Patriot PAC-3 MSE interceptors have reported high interception rates against traditional ballistic missiles, the sheer volume of low cost Iranian Shahed drones has proven difficult to mitigate entirely.13 Debris from interceptions and direct hits have caused material damage to vital infrastructure, forcing companies like QatarEnergy and Aluminium Bahrain to declare force majeure on shipments.16
The resulting systemic trade rupture forces a rapid recalibration of global sourcing. Industries reliant on just in time delivery models for metals, chemicals, and fertilizers are now facing weeks of delays and exponentially higher freight costs.18 The global economy is pivoting toward a prioritization of supply chain resilience over pure cost efficiency, accelerating investments in alternative energy regions, domestic manufacturing, and green technologies.11
3. Analysis of Top 10 Directly Impacted Industries
The 2026 Iranian Gulf War has created immediate supply deficits across multiple sectors. Energy sector and macroeconomic analysis provides a detailed examination of the top 10 most directly impacted industries, detailing the extent of the shock, alternative global capacities, and the realistic timeframes for market stabilization.
3.1. Crude Oil Markets and Global Petroleum Supply
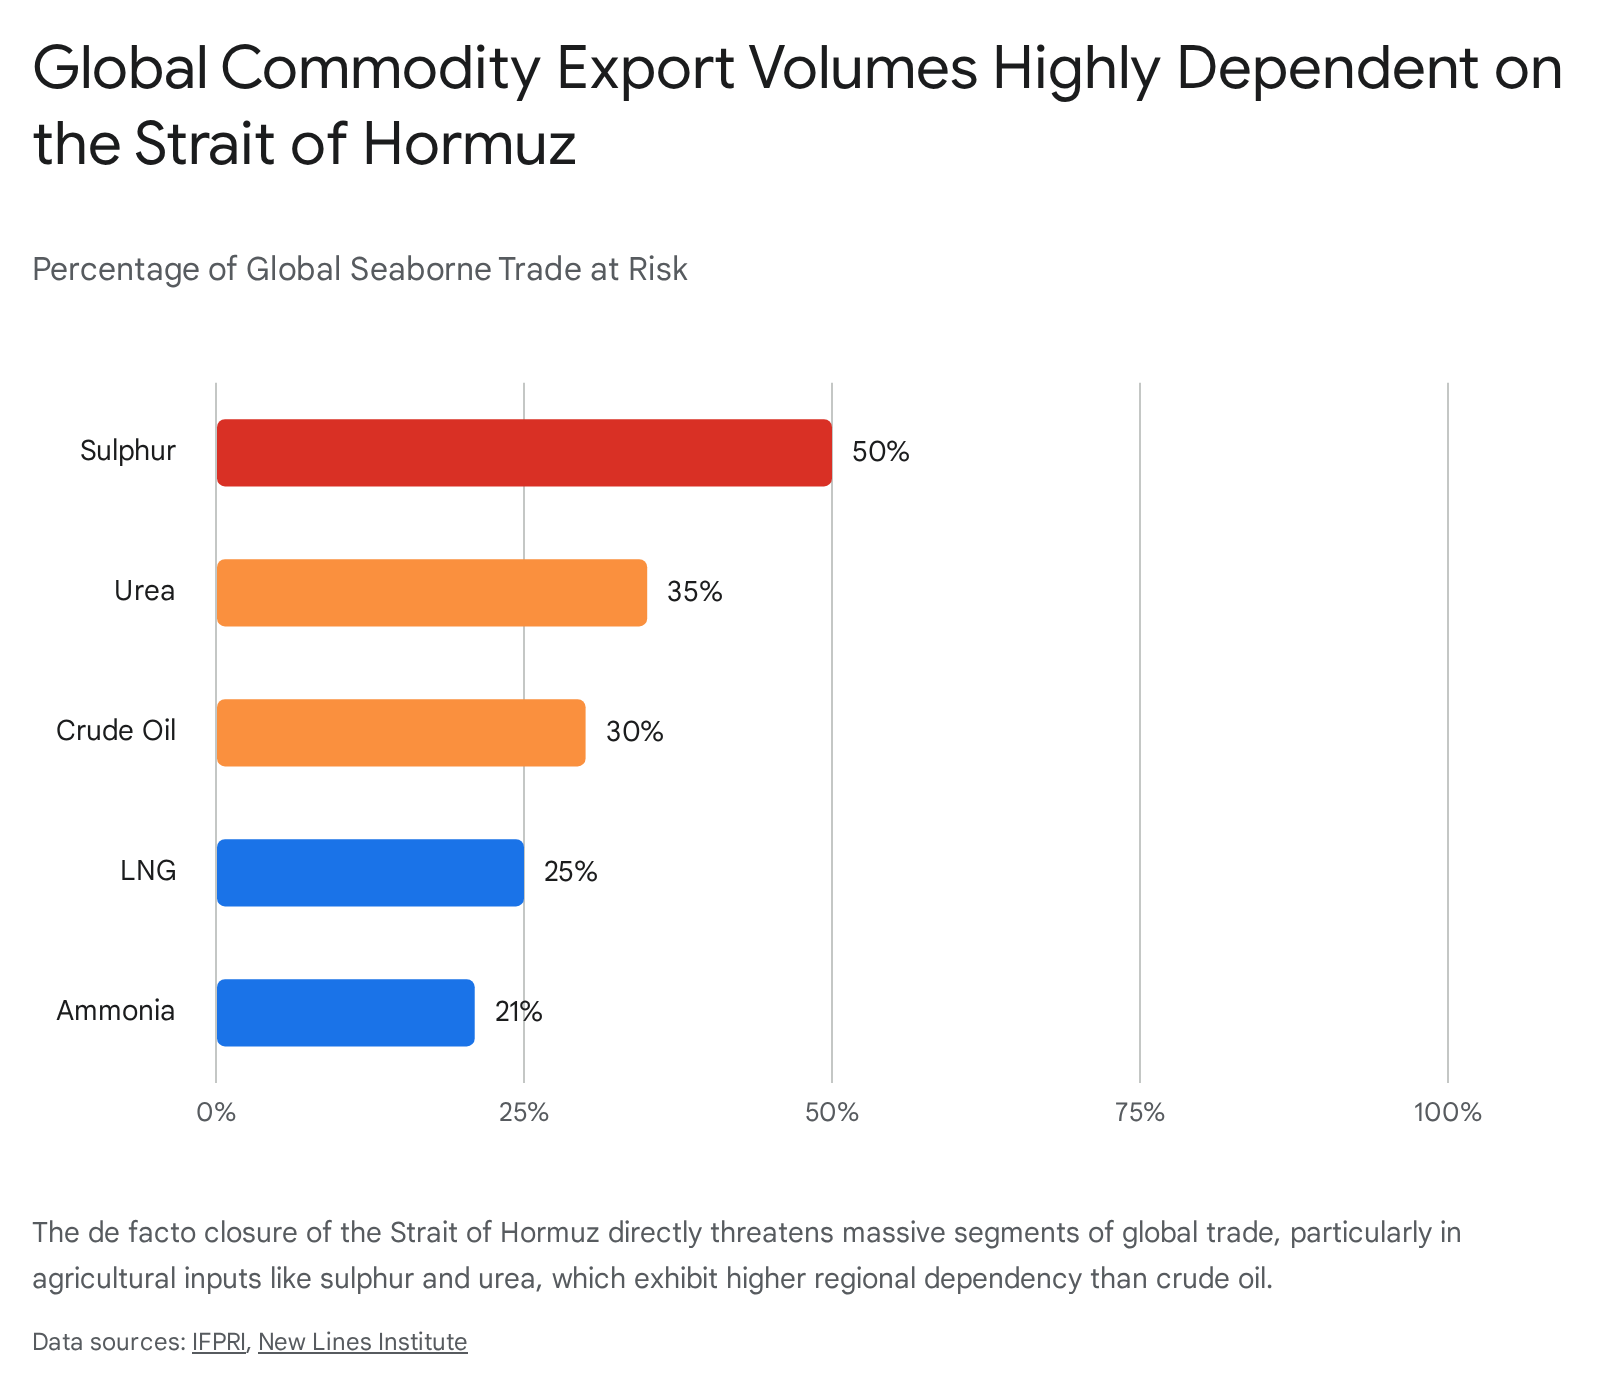
The Middle East accounts for roughly 30 percent of global oil production and nearly half of all global seaborne oil exports.11 The closure of the Strait of Hormuz effectively traps nearly 20 million barrels per day inside the Persian Gulf.11 Consequently, crude oil prices reacted violently in the opening days of the war. Brent crude surged past the $100 per barrel threshold, eventually reaching peaks near $126 per barrel amid fears of prolonged shortages.20
While Saudi Arabia maintains some alternative export routes via Red Sea pipelines, elevated attacks by regional proxy groups have historically constrained these corridors.22 The burden of replacing this monumental supply deficit falls primarily on non OPEC+ producers in the Americas. Global supply growth is projected to be driven heavily by countries outside the immediate conflict zone, though the timeline for this capacity to offset the crisis varies significantly.23
Alternative Capacity and Activation Timeframes
The United States, Canada, Guyana, and Brazil hold the greatest capacity to bridge the supply gap, though their production increases are structural rather than immediate.
- United States: The United States is forecast to lead global production growth, adding approximately 1.1 million barrels per day of capacity between 2024 and 2026.24 This growth is primarily driven by efficiencies in the Permian Basin in Texas and New Mexico.25 In December 2025, United States crude oil production hovered around 13.6 million barrels per day.26
- Canada: Canadian production is set to increase by 0.5 million barrels per day by 2026.23 This growth is heavily supported by the Trans Mountain pipeline expansion, which adds 600,000 barrels per day of takeaway capacity to the Pacific coast.23 However, analysts note that by late 2026, pipeline constraints could reappear, potentially exerting downward pressure on local pricing.27
- Brazil and Guyana: Offshore deepwater projects in South America are yielding significant output. Brazil is forecast to add 0.3 million to 0.48 million barrels per day by 2026, utilizing new floating production storage and offloading vessels.23 Notably, the startup of Equinor’s Bacalhau field has pushed Brazilian monthly production above 4.0 million barrels per day.28 Guyana is adding another 0.3 million barrels per day, bolstered by the Uaru development project expected to come online in 2026 following the success of the Yellowtail project.23
- Argentina: Shale production from Argentina’s Vaca Muerta region increased to over 500,000 barrels per day in 2025.23 Argentina is estimated to grow its production by another 130,000 barrels per day in 2026 as local takeaway capacity bottlenecks are resolved.23
- Venezuela: While Venezuela holds massive reserves, its capacity to rapidly pick up demand is severely restricted by deteriorated infrastructure, environmental compliance issues, and a lack of skilled labor.29 Venezuelan output will not immediately offset Gulf losses in 2026. However, if sanctions ease and transitional governance stabilizes the sector, heavy sour crude production could rise to over 1 million barrels per day between 2027 and 2030, and potentially up to 2.5 million barrels per day in the long term.30
| Producing Nation | Projected Capacity Addition (2024 to 2026) | Primary Growth Driver | Constraint or Bottleneck |
| United States | + 1.1 million barrels per day | Permian Basin efficiency | Capital discipline and natural depletion in older basins |
| Canada | + 0.5 million barrels per day | Trans Mountain Pipeline expansion | Looming pipeline capacity limits by late 2026 |
| Brazil | + 0.3 to 0.48 million barrels per day | Deepwater offshore vessels | High upfront costs and long development timelines |
| Guyana | + 0.3 million barrels per day | Uaru offshore development project | Infrastructure scaling |
| Argentina | + 0.13 million barrels per day | Vaca Muerta shale expansion | Midstream takeaway capacity |
| Venezuela | Negligible in 2026 | Sanctions relief and transitional governance | Severe infrastructure decay and labor shortages |
In the short term, global markets must rely on strategic petroleum reserves and demand destruction caused by high prices. Meaningful alternative physical barrels from the Americas will continue to ramp up through the end of 2026, but they cannot fully replace a sustained physical blockade of the Persian Gulf.31 The resulting feedback loop of excess supply pressures in the Americas versus extreme deficits in Eurasia will create a highly fractured global oil market.
3.2. Liquefied Natural Gas Production and Distribution
The Middle East produces approximately 18 percent of the world’s natural gas and accounts for 20 to 30 percent of global liquefied natural gas exports.11 Qatar alone is responsible for nearly 20 percent of global liquefied natural gas supply.16 Following Iranian attacks on industrial centers and the closure of the Strait of Hormuz, QatarEnergy declared force majeure on all liquefied natural gas shipments in early March 2026.16 This massive supply extraction caused global natural gas prices to surge by over 40 percent, exacerbating an existing global gas market deficit.11
The disruption is particularly acute for European and Asian markets that heavily depend on continuous seaborne gas deliveries to fuel power grids and industrial heating operations. The sudden loss of Qatari volumes forces these regions to compete aggressively in the spot market for uncontracted cargoes.
Alternative Capacity and Activation Timeframes
The United States and Canada are the primary regions positioned to absorb this displaced demand, fueled by a wave of new export terminal completions and massive contracting activity. In 2025 alone, United States developers signed sale and purchase agreements for 40 million tons per annum of liquefied natural gas, equal to 5.2 billion cubic feet per day.33
- United States Gulf Coast: United States capacity is expanding aggressively. The Department of Energy recently approved a 12 percent expansion at Cheniere Energy’s Corpus Christi terminal in Texas, raising its authorized export capacity to 4.45 billion cubic feet per day and making it the second largest export project in the nation.34 Furthermore, projects such as Plaquemines Phase 2 and Golden Pass are actively under construction.36 Total United States export capacity is projected to surge from roughly 14.3 billion cubic feet per day in 2025 to 23.5 billion cubic feet per day by 2030.38
- Canada: Canada’s first major export terminal, LNG Canada in British Columbia, shipped its first cargo in late June 2025 and is slated to reach its full 1.84 billion cubic feet per day capacity in 2026.37 This West Coast location is highly strategic, as it reduces shipping times to Asian markets by 50 percent compared to United States Gulf Coast terminals.37 Additional projects like Woodfibre and Cedar will add further capacity by 2027 and 2028 respectively.37
- Mexico: Developers are constructing two export projects in Mexico with a combined capacity of 0.6 billion cubic feet per day, including the Fast LNG Altamira floating production vessel off the east coast and Energia Costa Azul on the west coast.37
| Export Facility Project | Location | Export Capacity | Projected Full Operational Timeline |
| Corpus Christi Stage 3 (Trains 8 & 9) | Texas, United States | Up to 4.45 billion cubic feet per day total | Phased ramp up through 2026 |
| LNG Canada (Phase 1) | British Columbia, Canada | 1.84 billion cubic feet per day | Reaching full capacity in 2026 |
| Golden Pass | Texas, United States | 2.1 billion cubic feet per day | First train expected mid-2026 |
| Plaquemines (Phase 2) | Louisiana, United States | 2.7 billion cubic feet per day (growing) | Ramp up through 2026 into 2027 |
| Woodfibre | British Columbia, Canada | 0.3 billion cubic feet per day | Expected start in 2027 |
| Cedar (Floating) | British Columbia, Canada | 0.4 billion cubic feet per day | Expected start in 2028 |
While North America is constructing the capacity to replace Qatari gas, the timeframe is staggered. Terminals currently undergoing commissioning require three to six months to ramp up to full commercial operation.39 Therefore, Europe and Asia will face intense competition and severe price premiums for spot cargoes throughout 2026 until the North American capacity fully materializes and normalizes the market imbalance.
3.3. Methanol and Petrochemical Feedstocks
Methanol is a critical chemical building block globally. It is primarily utilized in the methanol to olefin process and in the synthesis of formaldehyde, which is essential for resins, plastics, adhesives, and construction materials.40 The Middle East is a dominant force in this sector, utilizing abundant low cost natural gas feedstocks to dominate the regional market.41 Saudi Arabia is the largest regional producer, while Iran is a massive exporter, shipping approximately 9 million tonnes annually, predominantly to China.41
The effective shut in of the Strait of Hormuz has stranded an estimated 18 to 20 million tonnes per year of Middle Eastern methanol supply.42 In a globally traded market of roughly 55 million tonnes, this represents a catastrophic supply shock.42 Consequently, methanol futures in China have spiked significantly, and regional prices in the Middle East jumped by 7 percent in a single week during the early stages of the conflict.12
Alternative Capacity and Activation Timeframes
The immediate loss of Middle Eastern methanol exports forces global buyers to look toward established producers in the Americas and emerging green technology sectors in Asia and Europe.
- The Americas and Oceania: Global producers like Methanex operate distributed networks with facilities in the United States, Canada, Trinidad, Chile, and New Zealand.42 These facilities boast a combined capacity of over 10.4 million tonnes per year and produced 7.8 million tonnes in 2025.42 While these plants are currently operating, they will prioritize existing contract customers and lack the immediate spare capacity to fully replace 20 million tonnes of stranded Middle Eastern product overnight.42 North America has been closing the gap between domestic supply and demand over the past decade due to cheap domestic shale gas, making it a more self sufficient market, but limited in its ability to rescue Asia.43
- Green and Bio-Methanol Production: Over the medium to long term, the market is shifting toward bio-methanol and e-methanol to lower carbon emissions. The European Union’s Net Zero Industry Act and Renewable Energy Directive are accelerating adoption through funding and policy support.44 By 2030, Singapore aims to produce over 1 million metric tons of low carbon methanol.44 Furthermore, China is rapidly retrofitting infrastructure in provinces like Shanxi, targeting massive upgrades to methanol fuel stations by 2025.44
In the immediate 2026 timeframe, the methanol market will suffer severe rationing. Downstream manufacturers in Asia will be forced to draw down inventories rapidly. The high cost of alternative natural gas feedstocks globally will keep replacement methanol prices elevated until Middle Eastern shipping resumes, squeezing margins for manufacturers of plastics, paints, and automotive parts worldwide.
3.4. Urea and Nitrogen Based Fertilizers
The global agricultural sector is highly exposed to the Gulf conflict, creating severe food security risks. The Middle East accounts for approximately 35 percent of the global seaborne trade in urea, exporting roughly 18 to 20 million tonnes annually.22 Industrially, urea is produced through the reaction of ammonia and carbon dioxide under high pressure, heavily relying on natural gas availability.47 The disruption of natural gas supplies and the physical blockade of vessels have effectively choked off supply from major exporters like Saudi Arabia and Qatar.45
Within 48 hours of the initial military strikes, North African urea prices surged by nearly 20 percent.48 Southeast Asian spot prices spiked to $700 per tonne, and United States Gulf futures jumped to $500 per tonne on the commodities exchange.46 This price shock comes at a highly sensitive time, as the Northern Hemisphere enters its critical spring planting season.
Alternative Capacity and Activation Timeframes
The immediate burden of replacing Middle Eastern urea shifts to producers in Southeast Asia and North America, though the transition is fraught with logistical and pricing challenges.
- Southeast Asia and Oceania: Countries heavily reliant on Middle Eastern urea, such as Australia and Thailand, are pivoting rapidly to regional neighbors. Australia imports approximately 64 percent of its urea from the Middle East, while Thailand relies heavily on Saudi Arabia.22 Producers in Malaysia, Brunei, and Vietnam are stepping in to fill the void. For example, Vietnam’s Ca Mau facility successfully diverted 40,000 tonnes of granular urea to Australia for April 2026 loading to support the impending fertilizer application season.46
- North America: United States farmers entered the 2026 spring planting season with roughly 75 percent of their required fertilizer supplies already secured locally.49 However, because fertilizers are globally priced commodities, United States domestic prices will still rise in sympathy with global shortages, adding to the record high input costs for American agriculture.49
- China: While China is a massive urea producer, a persistent global price premium could lead the Chinese government to delay exports to protect domestic agricultural stability, further tightening the global market.48
The capacity to pick up urea demand exists in Asia and the Americas, and transactions are occurring within a rapid timeframe via the spot market. However, the sheer volume of displaced Middle Eastern urea means alternative suppliers can only partially mitigate the shortfall. This will lead to sustained high input costs for global farmers throughout the 2026 growing seasons, potentially forcing crop switching and lowering overall yields.22
3.5. Sulphur and Phosphate Fertilizer Complexes
Sulphur is a vital raw material required for the production of phosphate fertilizers, specifically monoammonium phosphate and diammonium phosphate. The Mideast Gulf exercises profound dominance over this market, originating fully 50 percent of the global seaborne sulphur trade, which totals approximately 20 million tonnes annually.22 The region also directly accounts for 20 percent of global monoammonium phosphate and 14 percent of global diammonium phosphate exports, primarily loaded from Saudi Arabia’s Ras al-Khair port.22
The blockade has triggered immediate price shocks, with United States Gulf diammonium phosphate prices climbing to $655 per metric ton in the first week of the war.22 The disruption severely threatens fertilizer producers in India and Morocco, which rely heavily on Middle Eastern sulphur and ammonia to manufacture finished phosphates for the global export market.22
Alternative Capacity and Activation Timeframes
Replacing 50 percent of the world’s sulphur is structurally challenging, and the timeframe for securing alternatives is heavily constrained by industrial realities.
- Global Industrial Alternatives: Alternative sourcing must rely on by product sulphur captured from oil and gas refining operations in North America, China, and Russia. However, redirecting these flows involves complex logistical realignments and cannot be accomplished overnight. The lack of idle global sulphur capacity means the supply shock will be immediate and severe.
- Agricultural Adaptation and Crop Switching: The primary alternative in this sector is demand destruction and agricultural adaptation. If the conflict restricts supplies beyond a few weeks, farmers in the Southern Hemisphere and South Asia will alter planting decisions. Producers will likely shift away from input intensive crops like maize, wheat, and rice in favor of oilseeds such as soybeans, which require significantly less applied nitrogen and phosphate.22
- Regional Food Security Corridors: For the Persian Gulf countries themselves, which are highly dependent on agricultural imports through the Strait of Hormuz, alternative overland routes are being established. Grain shipments are moving from Russia to Iran and from Turkey to Iraq, but these overland routes incur significantly higher costs compared to maritime bulk shipping.22
| Fertilizer Component | Middle East Global Export Share | Primary Affected Importers | Market Mitigation Strategy |
| Sulphur | 50 percent | China, Morocco, India, Africa | Sourcing by product sulphur from global refining operations |
| Urea | 35 percent | Brazil, India, Thailand, Australia | Southeast Asian spot market purchases (Vietnam, Malaysia) |
| Ammonia | 21 percent | India, Morocco, South Korea | Global inventory drawdowns and delayed production |
| Diammonium Phosphate | 14 percent | India (primarily Q3 demand) | Reduced application rates and crop switching to oilseeds |
The shock to the phosphate supply chain will manifest as lower global crop yields and heightened food insecurity in vulnerable import dependent nations.22 Energy costs associated with post farmgate expenses, such as milling and refrigeration, will further exacerbate global food inflation.22
3.6. Primary Aluminum Smelting and Manufacturing
Aluminum smelting is incredibly energy intensive, making the energy rich Middle East a key global producer. The region accounts for 8 to 9 percent of global primary aluminum production and serves as a vital swing supplier to Europe, the United States, and non China Asian markets.17 The war has devastated this sector in the short term. Following the cessation of liquefied natural gas supplies from QatarEnergy, the Qatalum smelter was forced into a controlled shutdown.17 Simultaneously, Aluminium Bahrain declared force majeure due to the inability to export finished metal or import raw alumina through the heavily contested Strait of Hormuz.17
This immediate collapse in supply sent London Metal Exchange aluminum prices surging to near four year highs of $3,499.50 per ton.51 United States consumers are exceptionally vulnerable to this shock. The Middle East previously supplied nearly a fifth of United States aluminum imports, and domestic buyers are already squeezed by historical import tariffs.19
Alternative Capacity and Activation Timeframes
The aluminum supply chain operates on strict just in time delivery models, meaning supply disruptions cause immediate factory chaos for automotive, appliance, and construction manufacturers.19
- Asia and Australia Sourcing: United States buyers and manufacturers, such as Bonnell Aluminum and RM Metals, are urgently scrambling to secure alternative cargoes from markets in India and Australia.19 Procurement teams are forced to operate on accelerated timelines of days to secure metal before inventory runs dry.19
- North American Domestic Market: Manufacturers may tap the domestic United States or Canadian markets for near term deliveries, provided there is uncontracted spot metal available outside of annual agreements.19 Canada remains the largest foreign supplier to the United States and serves as a critical buffer.19
- Structural Timelines: The search for alternative supplies is occurring rapidly. However, because new aluminum smelting capacity takes years to build and requires massive energy infrastructure, the global market will remain in a severe deficit until Middle Eastern logistics normalize.52 Furthermore, rising global energy costs threaten to inflate production costs for smelters worldwide, compounding the pricing pressure and leading to potential demand destruction over the medium term.51
3.7. Iron Ore Pellets and Direct Reduced Iron Steel
The conflict has disrupted raw material flows vital to modern steelmaking across the Gulf. Iran and Bahrain collectively accounted for roughly 18 percent of global seaborne iron ore pellet exports in 2025.18 These pellets are specifically graded for use in direct reduced iron facilities. The outbreak of hostilities abruptly halted bulk carriers from entering the Gulf to supply these plants, with shipping data indicating zero bulk carriers loaded with iron ore entering the Gulf in early March.18 Several vessels bound for Gulf ports diverted away from the region, risking a collapse in regional steel production and weighing heavily on local construction activity.18
Alternative Capacity and Activation Timeframes
The global iron ore pellet supply base is geographically diverse, allowing for a somewhat structured realignment of trade flows, though quality specifications remain a critical constraint.
- South America: Brazil remains a dominant force in high grade pellet exports, with major producers like Vale and Samarco holding significant capacity.53 Although Vale slightly adjusted its 2026 output guidance, Brazilian export volumes remain robust and capable of absorbing diverted global demand.54
- Asia: India is actively expanding its footprint in the seaborne market. State owned NMDC Limited has initiated long term pellet sales from its Donimalai plant, and Indian export capacities are well positioned to serve Asian buyers pivoting away from Middle Eastern suppliers.55 China, India, and South Korea are expected to showcase promising growth in pellet sales.55
- Eastern Europe: Despite regional conflicts, Ukraine’s Metinvest has demonstrated remarkable production resilience, allocating massive investments to scale pellet production and launching 11 new product types.55
- Market Realignment Timeline: Iron ore trade flows will shift over the course of the 2026 fiscal quarters. Shippers are currently restructuring short term cargo offers to account for higher freight and insurance costs.56 Market participants anticipate that the convergence of Brazilian capacity scaling and Indian procurement expansion will stabilize the high grade pellet market by late 2026.55 Chinese mills, facing sluggish domestic property sector demand, are maintaining cautious inventory light models and prioritizing cost effective procurement channels.54
3.8. Air Freight Cargo Capacity and Global Logistics
The airspace restrictions and safety risks resulting from the intense missile exchanges have severely crippled the Middle East’s role as a global aviation transit hub. Key consolidation points, specifically Dubai, Abu Dhabi, and Doha, have seen operations vastly degraded with over 3,400 flights cancelled or diverted.20 In 2024, Dubai and Doha processed 2.2 million and 2.6 million tonnes of freight respectively, representing roughly two thirds of all Middle Eastern air cargo.58
The sudden restriction of these critical hubs removed an estimated 12 percent of global cargo capacity from the market overnight.59 This capacity shock occurred against a backdrop of already rising global demand, pushing dynamic load factors higher and driving air cargo spot rates up by 5 percent globally.59 Specific corridors felt the shock more acutely, with Europe to North America rates seeing 21 percent spikes, and the Northeast Asia to North America semiconductor corridor seeing rates grow by 10 percent.59
Alternative Capacity and Activation Timeframes
The logistics industry is highly agile, but rerouting global trade around a major continental hub incurs severe time and cost penalties.
- Alternative Flight Routing: Carriers are forced to divert flights, adding intermediate stops and avoiding the airspace entirely.60 Freight forwarders are shifting volumes to the Transpacific corridor and utilizing direct Asia to Europe routes that bypass the Gulf entirely.57
- Intermodal Solutions: Shippers are increasingly relying on sea air combinations via alternative regional ports, though these multimodal solutions add significant transit time and complexity.
- Duration of Impact: The capacity crunch is immediate and will persist for the exact duration of the military conflict and airspace closures.20 The logistics market’s recovery is entirely dependent on the cessation of hostilities. Furthermore, rising jet fuel costs, which are directly tied to the crude oil price spikes caused by the Strait of Hormuz blockade, will further inflate air freight rates in the short to medium term, acting as a major cost component for all diverted flights.20
3.9. Water Desalination and Regional Security Infrastructure
Unlike globally traded commodities, the disruption to water desalination infrastructure presents an existential and strictly localized crisis for the Persian Gulf. The Gulf states, often referred to as saltwater kingdoms, rely on more than 400 desalination plants to provide drinking water for approximately 100 million people.61 In nations like Kuwait, Oman, and Saudi Arabia, energy intensive desalination accounts for 70 to 90 percent of the municipal water supply.62
Iran has explicitly targeted this critical infrastructure. Drone strikes have caused material damage to a water desalination plant in Bahrain, marking the first time a Gulf nation reported targeting of such a facility during the conflict.63 Additionally, Iranian projectiles have landed dangerously close to Dubai’s massive Jebel Ali complex, which produces over 160 billion gallons of water a year.61 Furthermore, because many desalination plants are physically integrated with local power grids via combined heat and power systems, attacks on general energy infrastructure pose severe cascading risks to water production.64
Alternative Capacity and Activation Timeframes
The water security crisis in the Gulf is unique because it cannot be solved through international trade or global supply chain realignment.
- Lack of Viable Alternatives: There are no external regions that can supply municipal water to the Middle East at the required scale. Alternatives such as mobile desalination units or imported bottled water tankers are logistically incapable of sustaining populations of millions.61
- Timeframe to Crisis: The timeframe for this shock is measured in days, not months. Defense analysts warn that if major plants are knocked offline, entire cities could deplete their drinking water reserves within 48 to 72 hours.65
- Security Mobilization: To mitigate this existential threat, regional governments are urgently attempting to hire private foreign military specialists, radar operators, and electronic warfare technicians to bolster the layered defense of these facilities.15 Private military corporations are seeing increased demand for ground security teams and system specialists to provide protection during active operations.15
3.10. Defense Industrial Base and Munitions Manufacturing
The unprecedented intensity of Operation Epic Fury has placed massive strain on the United States defense industrial base. The air campaign requires an extraordinary expenditure of precision guided munitions and interceptors to systematically dismantle Iranian ballistic capabilities and defend regional assets.8 The operation is estimated to cost nearly $900 million per day, driven heavily by munition consumption.68 Key assets being depleted rapidly include Joint Direct Attack Munitions, Tomahawk cruise missiles, AIM-9X air to air missiles, and Patriot PAC-3 MSE interceptors.66
The United States military was already firing interceptors in the Red Sea at rates faster than they could be manufactured prior to the Iran conflict.70 The current war has exposed structural bottlenecks in the American defense supply chain that cannot be resolved quickly by merely increasing budget allocations or utilizing the Defense Production Act.
Alternative Capacity and Activation Timeframes
The capacity to pick up this manufacturing demand relies entirely on domestic and allied defense contractors, but the supply chain is highly constrained by industrial physics.
- Industrial Bottlenecks and Specialty Chemistry: Final assembly of missiles is rarely the binding constraint. The production of solid rocket motors is limited by a narrow slice of specialty chemistry.70 Specifically, the supply of ammonium perchlorate, a critical oxidizer, is consolidated into very few vulnerable domestic production nodes.70 Curing times for rocket propellants and strict qualification regimes for energetic materials cannot be safely rushed.70
- Rare Earth Mineral Dependence: Advanced missiles require rare earth minerals like neodymium and samarium for guidance systems, and tungsten for kinetic penetrators.70 The processing of these critical minerals is heavily dominated by China, creating a severe strategic vulnerability for the United States defense supply chain.70
- Production Surges and Investment: The defense sector, led by primes like Lockheed Martin, RTX, and L3Harris, is attempting to surge output, treating the conflict as a primary growth engine.71 The Pentagon has executed massive direct investments into rocket motor businesses to secure propulsion supplies.70
- Activation Timeframe: Replenishment timelines are measured in years, not months. For context, prior to the surge, Patriot PAC-3 MSE missiles were produced at a rate of only 600 to 650 annually.69 The defense industrial base will require a multi year mobilization stretching through 2027 and 2030 to replace the massive inventories expended in the 2026 conflict.70
4. Geopolitical Responses and Regional Defense Postures
The 2026 Iranian Gulf War has catalyzed a profound shift in regional defense postures and diplomatic alignments. Foreign affairs analysts note that the scale of the Iranian retaliation forced an unprecedented all of government response across the Gulf Cooperation Council.72 For the first time in history, all Gulf Cooperation Council states were targeted by the same actor within a 24 hour period, realizing a long standing strategic nightmare for regional planners.72
The performance of regional integrated air and missile defense networks has been a critical variable in mitigating the conflict’s economic fallout. A years long effort to boost United States and Gulf security cooperation has yielded positive tactical results. The United Arab Emirates reported intercepting 175 of 189 detected ballistic missiles and 876 of 941 detected drones, representing interception rates exceeding 92 percent.13 Qatar similarly reported intercepting 98 of 101 ballistic missiles, and Bahrain successfully destroyed dozens of incoming projectiles.14
However, the national security analysis reveals a critical vulnerability regarding sustainability. While the interception rates are high, the cost asymmetry heavily favors Iran. Iran relies on comparatively cheap drones and legacy ballistic missiles, whereas the Gulf states expend highly sophisticated, multi million dollar interceptors.13 Gulf nations, including the United Arab Emirates and Qatar, have already urgently requested the United States to help replenish their dwindling interceptor stockpiles.13
Diplomatically, the conflict is accelerating the fragmentation of the global order. Russia faces a strategic dilemma regarding its partnership with Iran. While Russia is not operationally dependent on Iran for its war in Ukraine, Moscow is actively sharing intelligence to support Iranian strikes against United States forces, seeking to tie down American military resources in the Middle East.8 Conversely, China finds itself trapped by the closure of the Strait of Hormuz, a waterway through which 45 percent of its imported oil and gas passes.9 Beijing is reportedly highly displeased with Tehran’s blockade and is actively engaging in direct negotiations with Iranian officials to secure safe passage exemptions for Chinese flagged tankers.9 However, maritime tracking data indicates that despite these diplomatic efforts, Chinese vessels remain largely frozen in the Gulf alongside Western shipping, exposing the limits of Beijing’s leverage over Tehran during an active survival crisis.7
5. Strategic Conclusions and Long Term Outlook
The 2026 Iranian Gulf War has demonstrated with absolute clarity that the global economy remains dangerously exposed to single point logistical failures. While the immediate focus of Operation Epic Fury has been the kinetic degradation of Iranian military and proxy capabilities, the second order effects have triggered a systemic reorganization of global supply chains.
The aggregated economic and energy sector data indicates that while energy markets have robust structural plans to increase capacity in the Americas, these additions are staggered over years. They cannot instantly replace the 20 million barrels of oil and massive volumes of gas trapped behind the Strait of Hormuz. Consequently, the global economy faces unavoidable short term inflationary pressures and heightened volatility in energy pricing through the remainder of 2026.
More critically, the conflict has highlighted severe vulnerabilities in less visible, yet equally vital, supply chains. The Middle East’s outsized role in the export of agricultural inputs poses a direct threat to global food security. A prolonged blockade will force structural changes in global agriculture, heavily impacting crop yields in import dependent regions across the Global South. Simultaneously, the rapid depletion of precision guided munitions has exposed the fragility of the United States defense industrial base, revealing deep dependencies on fragile chemical supply chains and foreign processed rare earth elements.
Ultimately, the geoeconomic legacy of this conflict will be a forced acceleration away from optimized, single source globalism. Governments and multinational corporations are now heavily incentivized to prioritize redundancy, invest massively in alternative geographic hubs across the Americas and Asia, and subsidize domestic manufacturing for critical materials, regardless of the immediate financial costs. The era of assuming uninterrupted access to the Persian Gulf has decisively ended.
Please share the link on Facebook, Forums, with colleagues, etc. Your support is much appreciated and if you have any feedback, please email us in**@*********ps.com. If you’d like to request a report or order a reprint, please click here for the corresponding page to open in new tab.
Works cited
- 2026 Iran conflict | Explained, United States, Israel, Map, & War | Britannica, accessed March 9, 2026, https://www.britannica.com/event/2026-Iran-Conflict
- Peace Through Strength: President Trump Launches Operation Epic Fury to Crush Iranian Regime, End Nuclear Threat – The White House, accessed March 9, 2026, https://www.whitehouse.gov/articles/2026/03/peace-through-strength-president-trump-launches-operation-epic-fury-to-crush-iranian-regime-end-nuclear-threat/
- Middle East Special Issue: March 2026, accessed March 9, 2026, https://acleddata.com/update/middle-east-special-issue-march-2026
- How Gulf States are responding to Iran’s retaliatory strikes, accessed March 9, 2026, https://www.washingtonexaminer.com/news/world/4476568/gulf-states-qatar-saudi-arabia-kuwait-bahrain-uae-responding-iran-retaliatory-strikes/
- Iran has largely halted oil and gas exports through strait of Hormuz – The Guardian, accessed March 9, 2026, https://www.theguardian.com/world/2026/mar/03/iran-has-largely-halted-oil-and-gas-exports-through-strait-of-hormuz
- March 8, 2026: Iran War Maritime Intelligence Daily – Windward, accessed March 9, 2026, https://windward.ai/blog/march-8-maritime-intelligence-daily/
- No One, Not Even Beijing, Is Getting Through the Strait of Hormuz, accessed March 9, 2026, https://www.csis.org/analysis/no-one-not-even-beijing-getting-through-strait-hormuz
- Iran Update Evening Special Report, March 6, 2026, accessed March 9, 2026, https://understandingwar.org/research/middle-east/iran-update-evening-special-report-march-6-2026/
- China Seeks Iran Deal for Tanker Passage Through Closed Strait of Hormuz, accessed March 9, 2026, https://chinaglobalsouth.com/2026/03/09/china-iran-strait-of-hormuz-oil-shipments/
- 2026 Iran war – Wikipedia, accessed March 9, 2026, https://en.wikipedia.org/wiki/2026_Iran_war
- The Energy Shock: U.S.-Israel War with Iran’s Impact on Indian …, accessed March 9, 2026, https://newlinesinstitute.org/middle-east-center/the-energy-shock-u-s-israel-war-with-irans-impact-on-indian-chinese-and-global-economies/
- ChemAnalyst Digest: How Iran War Affects Chemical Prices Globally, Should You be Worried?, accessed March 9, 2026, https://www.chemanalyst.com/NewsAndDeals/NewsDetails/chemanalyst-digest-how-iran-war-affects-chemical-prices-41348
- War Comes to the Gulf | The Washington Institute, accessed March 9, 2026, https://www.washingtoninstitute.org/policy-analysis/war-comes-gulf
- Iran’s drone and missile attacks on Gulf countries in numbers, accessed March 9, 2026, https://english.alarabiya.net/News/gulf/2026/03/04/iran-s-drone-and-missile-attacks-on-gulf-countries-in-numbers-
- Gulf states turn to private foreign military specialists amid Iran attacks, accessed March 9, 2026, https://www.middleeasteye.net/news/gulf-states-turn-private-foreign-military-specialists-amid-iran-attacks
- Commercial and Supply Chain Implications of the Gulf Conflict …, accessed March 9, 2026, https://www.gibsondunn.com/commercial-and-supply-chain-implications-of-the-gulf-conflict-shipping-contracts-and-insurance/
- The Middle East conflict and its impact on global metals markets, accessed March 9, 2026, https://www.argusmedia.com/en/news-and-insights/market-opinion-and-analysis-blog/middle-east-conflict-impact-global-metals-markets
- Middle East war disrupts dry bulk commodity trade as Hormuz shipping grinds to a halt, accessed March 9, 2026, https://www.kpler.com/blog/middle-east-war-disrupts-dry-bulk-commodity-trade-as-hormuz-shipping-grinds-to-a-halt
- US aluminium buyers hunt for alternatives as Iran war upends global supply, accessed March 9, 2026, https://www.businesstimes.com.sg/companies-markets/energy-commodities/us-aluminium-buyers-hunt-alternatives-iran-war-upends-global-supply
- Iran conflict tests 2026 air cargo outlook – Supply Chain Dive, accessed March 9, 2026, https://www.supplychaindive.com/news/middle-east-conflict-tests-2026-air-cargo-outlook/814069/
- 2026 Strait of Hormuz crisis – Wikipedia, accessed March 9, 2026, https://en.wikipedia.org/wiki/2026_Strait_of_Hormuz_crisis
- The Iran war: Potential food security impacts | IFPRI, accessed March 9, 2026, https://www.ifpri.org/blog/the-iran-war-potential-food-security-impacts/
- 2026 Outlook Energy Sector – Gabelli, accessed March 9, 2026, https://gabelli.com/research/2026-outlook-energy-sector/
- Petroleum liquids supply growth driven by non-OPEC+ countries in 2025 and 2026 – U.S. Energy Information Administration (EIA), accessed March 9, 2026, https://www.eia.gov/todayinenergy/detail.php?id=64565
- EIA forecasts U.S. crude oil production will decrease slightly in 2026 – U.S. Energy Information Administration (EIA), accessed March 9, 2026, https://www.eia.gov/todayinenergy/detail.php?id=66844
- United States Crude Oil Production – Trading Economics, accessed March 9, 2026, https://tradingeconomics.com/united-states/crude-oil-production
- Canadian Production Set for 3.5% Increase in 2026: Possible Pipeline Constraints Loom – A Plainview on Crude Oil, accessed March 9, 2026, https://www.plainview-energy.com/p/plainview-weekly-canadian-production
- Brazil, Guyana, and Argentina support forecast crude oil growth in 2026 – U.S. Energy Information Administration (EIA), accessed March 9, 2026, https://www.eia.gov/todayinenergy/detail.php?id=66884
- Venezuelan Oil Supply Crisis: Market Implications for 2026 – Fubex Lubricants, accessed March 9, 2026, https://fubex.net/blog/venezuelan-oil-supply-crisis-market-implications-for-2026/
- Breaking Down Venezuela’s Oil Outlook for the future – Aurora Energy Research, accessed March 9, 2026, https://auroraer.com/resources/aurora-insights/articles/breaking-down-venezuelas-oil-outlook-for-the-future
- EIA sees 2026 oil production decline despite regional growth, accessed March 9, 2026, https://energy-oil-gas.com/news/eia-sees-2026-oil-production-decline-despite-regional-growth/
- Gains, Risks and Regional Implications of US’ Iran War, accessed March 9, 2026, https://impakter.com/gains-risks-and-regional-implications-of-us-iran-war/
- U.S. LNG developers sign highest volume of sale and purchase contracts since 2022, accessed March 9, 2026, https://www.eia.gov/todayinenergy/detail.php?id=67264
- Energy Department Approves Export Expansion at Corpus Christi LNG, accessed March 9, 2026, https://www.energy.gov/articles/energy-department-approves-export-expansion-corpus-christi-lng
- Corpus Christi becomes second-largest US LNG export project thanks to export expansion approval, accessed March 9, 2026, https://www.offshore-energy.biz/corpus-christi-becomes-second-largest-us-lng-export-project-thanks-to-export-expansion-approval/
- Global LNG Capacity Tracker – Data Tools – IEA, accessed March 9, 2026, https://www.iea.org/data-and-statistics/data-tools/global-lng-capacity-tracker
- North America’s LNG export capacity could more than double by 2029 – U.S. Energy Information Administration (EIA), accessed March 9, 2026, https://www.eia.gov/todayinenergy/detail.php?id=66384
- US LNG Capacity Forecast to 2030 – Incorrys, accessed March 9, 2026, https://incorrys.com/liquefied-natural-gas-lng-forecast/north-american-lng-exports-to-2030/
- Iran Conflict Sets the LNG Markets on End: What Does This Mean for the Market, Investors, and Consumers?, accessed March 9, 2026, https://energynewsbeat.co/iran-conflict-sets-the-lng-markets-on-end-what-does-this-mean-for-the-market-investors-and-consumers/
- Innovation Outlook: Renewable Methanol, accessed March 9, 2026, https://methanol.org/wp-content/uploads/2020/04/IRENA_Innovation_Renewable_Methanol_2021.pdf
- Middle East Methanol Market Size | Industry Report, 2033, accessed March 9, 2026, https://www.grandviewresearch.com/industry-analysis/middle-east-methanol-market-report
- Methanex sees 18-20 million tonnes/year of Middle East methanol exports shut in – CEO, accessed March 9, 2026, https://www.icis.com/explore/resources/news/2026/03/06/11186452/methanex-sees-18-20-million-tonnes-year-of-middle-east-methanol-exports-shut-in-ceo
- Scaling Up Hydrogen: The Case for Low- Carbon Methanol – Bloomberg Professional Services, accessed March 9, 2026, https://assets.bbhub.io/media/sites/25/2024/06/BNEF-Methanol-Report_to-publish.pdf
- Green Methanol Market Growth, Forecast, and Industry Insights Report, accessed March 9, 2026, https://www.skyquestt.com/report/green-methanol-market
- Offers for urea derivatives evaporate, accessed March 9, 2026, https://www.argusmedia.com/news-and-insights/latest-market-news/2798316-offers-for-urea-derivatives-evaporate
- Urea derivatives surge on Middle East conflict | Latest Market News – Argus Media, accessed March 9, 2026, https://www.argusmedia.com/en/news-and-insights/latest-market-news/2794835-urea-derivatives-surge-on-middle-east-conflict
- Urea Market Size, Share & Growth Analysis | Report [2034] – Fortune Business Insights, accessed March 9, 2026, https://www.fortunebusinessinsights.com/urea-market-106850
- Global fertilizer markets feel impact of conflict in the Middle East – Rabobank, accessed March 9, 2026, https://www.rabobank.com/knowledge/q011517071-global-fertilizer-markets-feel-impact-of-conflict-in-the-middle-east
- Middle East Tensions Raise Spring Planting Concerns, accessed March 9, 2026, https://www.fb.org/market-intel/middle-east-tensions-raise-spring-planting-concerns
- Iran war to disrupt urea and sulphur supplies, accessed March 9, 2026, https://www.producer.com/crops/iran-war-to-disrupt-urea-and-sulphur-supplies/
- Aluminum Surges on Supply Fears Amidst Oil Shock, accessed March 9, 2026, https://www.whalesbook.com/news/English/commodities/Aluminum-Surges-on-Supply-Fears-Amidst-Oil-Shock/69ae37116431e3e2859c2784
- Conflict in the Middle East threatens aluminium and alumina trade flows – CRU Group, accessed March 9, 2026, https://www.crugroup.com/en/communities/thought-leadership/2026/Conflict-in-the-Middle-East-threatens-aluminium-and-alumina-trade-flows/
- Iron Ore Pellets Market Size, Share | Industry Report [2026-2034], accessed March 9, 2026, https://www.fortunebusinessinsights.com/iron-ore-pellets-market-113953
- A shift in iron ore trade flows, preferences across imported iron ore grades expected in 2026, accessed March 9, 2026, https://www.fastmarkets.com/insights/shift-iron-ore-trade-flows-across-imported-iron-ore-grades-expected/
- Iron Ore Pellets Market Size & Forecast 2026-2036 – Future Market Insights, accessed March 9, 2026, https://www.futuremarketinsights.com/reports/iron-ore-pellet-market
- Global iron ore exports soften in February 26 as Chinese buying slows – SteelOrbis, accessed March 9, 2026, https://www.steelorbis.com/steel-news/latest-news/global-iron-ore-exports-soften-in-february-26-as-chinese-buying-slows-1440147.htm
- Air Freight Market Update – DHL Global Forwarding – United States of America, accessed March 9, 2026, https://www.dhl.com/us-en/home/global-forwarding/latest-news-and-webinars/air-freight-market-update.html
- GCC Air Freight Transport Market – Size, Share & Industry Trends Analysis, accessed March 9, 2026, https://www.mordorintelligence.com/industry-reports/gcc-air-freight-transport-market
- Middle East conflict clouds air cargo outlook despite demand rise – STAT Times, accessed March 9, 2026, https://www.stattimes.com/air-cargo/middle-east-conflict-clouds-air-cargo-outlook-despite-demand-rise-1358298
- Global Outlook for Air Transport Trade, AI, and the energy transition – IATA, accessed March 9, 2026, https://www.iata.org/en/iata-repository/publications/economic-reports/global-outlook-for-air-transport-december-2025/
- Iran Threatens Gulf Water Lifeline, accessed March 9, 2026, https://impakter.com/iran-threatens-gulf-water-lifeline/
- Oil built the Persian Gulf. Desalinated water keeps it alive. War could threaten both – Florida Politics, accessed March 9, 2026, https://floridapolitics.com/archives/783951-oil-built-the-persian-gulf-desalinated-water-keeps-it-alive-war-could-threaten-both/
- How targeting of desalination plants could disrupt water supply in the Gulf – Al Jazeera, accessed March 9, 2026, https://www.aljazeera.com/amp/news/2026/3/8/how-targeting-of-desalination-plants-could-disrupt-water-supply-in-the-gulf
- US-Iran conflict targets desalination, fueling Middle East water crisis fears – CHOSUNBIZ, accessed March 9, 2026, https://biz.chosun.com/en/en-international/2026/03/09/ZGN5DVLHPVCTTEWWZNDNHYCNEE/
- Oil built the Persian Gulf. Desalinated water keeps it alive. War could threaten both, accessed March 9, 2026, https://apnews.com/article/iran-war-desalination-water-oil-middle-east-12b23f2fa26ed5c4a10f80c4077e61ce
- FPRI Experts React | Understanding the Third Gulf War, accessed March 9, 2026, https://www.fpri.org/article/2026/03/fpri-experts-react-understanding-the-third-gulf-war/
- Why Iran’s ballistic missile launches are declining, accessed March 9, 2026, https://www.fdd.org/analysis/2026/03/04/why-irans-ballistic-missile-launches-are-declining/
- Latest Analysis: War with Iran | CSIS, accessed March 9, 2026, https://www.csis.org/programs/latest-analysis-war-iran
- Trump rallies defense titans to surge weapons output as Iran War rages, accessed March 9, 2026, https://wfin.com/fox-political-news/trump-rallies-defense-titans-to-surge-weapons-output-as-iran-war-rages/
- How Chemistry and Rocket Motors Constrain American Warfighting …, accessed March 9, 2026, https://nationalinterest.org/blog/buzz/how-chemistry-and-rocket-motors-constrain-american-warfighting
- User, accessed March 9, 2026, http://markets.chroniclejournal.com/chroniclejournal/article/marketminute-2026-3-9-war-footing-us-defense-stocks-break-out-as-west-asia-conflict-reaches-fever-pitch
- ‘Nightmare scenario’ for GCC countries, region as Iran unloads drones and missiles, accessed March 9, 2026, https://breakingdefense.com/2026/03/iran-attacks-uae-saudi-missiles-drones-gcc-air-defense/
- The Iran war exposes the limits of Russia’s leverage in a …, accessed March 9, 2026, https://www.chathamhouse.org/2026/03/iran-war-exposes-limits-russias-leverage-fragmenting-regional-order