Tag Archives: Supply Chains

The Weaponization of Supply Chains: Critical Minerals and the 2026 Multipolar Defense Environment

Introduction: The Geoeconomic Paradigm Shift of 2026

The global economic architecture of 2026 represents a definitive and irreversible departure from the hyper-globalized, efficiency-optimized frameworks that characterized the post-Cold War era. The international system has transitioned into a highly fractured multipolar environment where bilateral trade and integrated supply chains are no longer viewed merely as neutral conduits for mutual prosperity, but rather as primary vectors for statecraft, coercion, and strategic preclusion.1 The weaponization of supply chains—specifically those underpinning critical minerals, rare earth elements, and advanced technological components—has emerged as the defining national security challenge of the decade. For the defense industrial bases of the United States, the European Union, and their aligned partners, the chaotic transition from “just-in-time” logistics to “just-in-case” structural resilience has triggered profound disruptions across both commercial and military manufacturing sectors.2

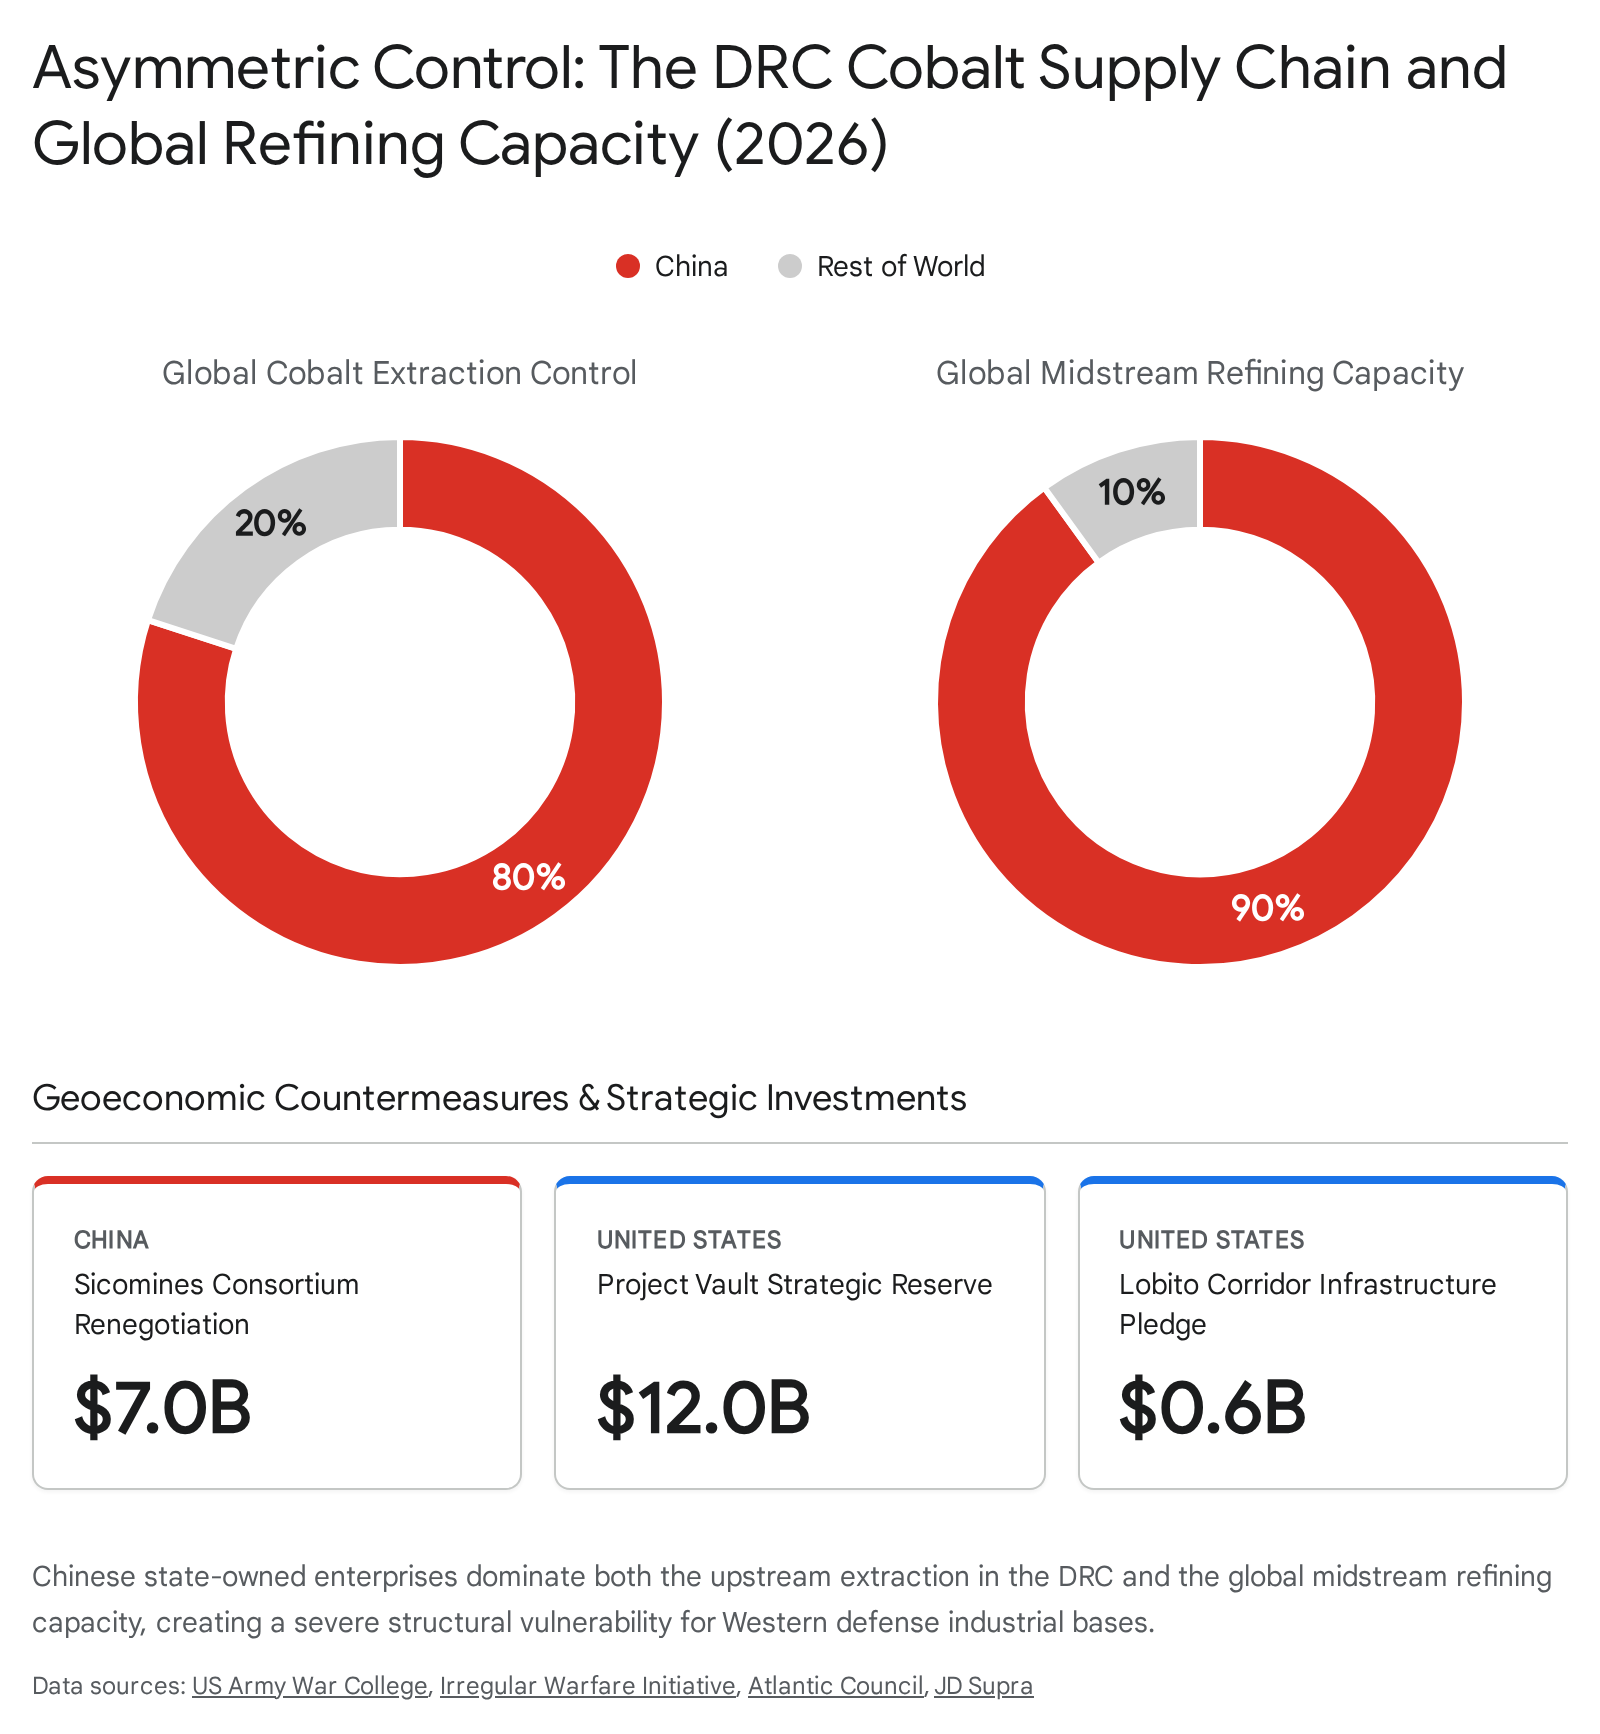
At the absolute center of this paradigm shift lies a fundamental misunderstanding long held by Western policymakers, often termed the “Mining Fallacy” by defense analysts.3 This fallacy posits the mistaken belief that resource security is strictly a function of possessing, accessing, or discovering geological reserves.3 It relies on the assumption that simply digging more holes in the ground guarantees a secure supply chain. In reality, the true center of gravity in modern economic warfare does not reside at the mine gate; it resides in the complex, highly toxic, and intensely capital-heavy midstream processing and refining sectors.3 The United States and its allies theoretically possess sufficient geological reserves of rare earth elements, cobalt, and copper to meet long-term demand.3 However, by systematically monopolizing between 85 percent and 90 percent of the world’s processing capacity for these critical materials, the People’s Republic of China (PRC) has engineered a systemic, end-to-end dependency that grants Beijing a functional “kill switch” over Western industrial capability.3

This comprehensive analysis dissects the mechanics and profound implications of supply chain weaponization in 2026. It meticulously examines foreign state control over the highly concentrated cobalt and copper sectors in the Democratic Republic of the Congo (DRC) and evaluates the strategic implications for the manufacturing of smart weapons, high-capacity batteries, and advanced aerospace components. The report further investigates the insidious nature of infrastructure capture through foreign control of South American energy grids, focusing specifically on the political and strategic crisis confronting Chile. Subsequently, the analysis details the sweeping architectural countermeasures implemented by the United States and the European Union—ranging from the physical infrastructure of the Lobito Corridor to the geoeconomic frameworks of Project Vault, the Forum on Resource Geostrategic Engagement (FORGE), and the Pax Silica alliance. Finally, the report quantifies the severe second-order effects of these geopolitical maneuvers on the production timelines and unit costs of advanced Western military hardware, offering a stark assessment of what defense economists now term the “price of resilience”.6

Section I: The Chokepoint in the Congo: Cobalt, Copper, and Strategic Monopolies

The Mechanics of Resource Capture in the Democratic Republic of the Congo

The Democratic Republic of the Congo (DRC) remains the undeniable global epicenter of the cobalt and copper trade, commanding an asymmetric influence over the raw materials required for the ongoing global energy transition and the modernization of advanced military forces. The DRC accounts for more than 70 to 80 percent of the world’s total cobalt output, alongside producing an estimated 3.3 million metric tons of copper annually.1 Cobalt is an indispensable element required for the production of high-capacity lithium-ion batteries, advanced munitions, and the high-temperature aerospace superalloys that form the backbone of modern military aviation.1 Over the past two decades, the PRC has systematically established a vice-like grip over the DRC’s mineral wealth, executing a patient, long-term strategy of infrastructure-for-resource deals that have fundamentally compromised the supply chain security of Western nations.1

As of 2026, Chinese state-owned enterprises (SOEs) and policy banks exercise control over roughly 80 percent of the DRC’s total cobalt output.1 The concentration of this control is staggering: of the ten largest cobalt mines globally—nine of which are located within the mineral-rich Katanga region of the DRC—five are under direct Chinese ownership and administration.1 This structural dominance was largely cemented by the original 2008 Sicomines agreement, a landmark $6 billion infrastructure-for-minerals exchange that successfully transferred ownership of 15 of the DRC’s 19 most lucrative cobalt and copper sites to Chinese entities.1

Over time, the asymmetric nature of this relationship generated intense political friction within the DRC. Congolese state auditors determined that the mining assets transferred to China had been vastly undervalued, while the promised infrastructure investments lagged significantly behind schedule, totaling less than $1 billion by 2023.1 Despite aggressive attempts by the government of President Félix Tshisekedi to renegotiate these terms to correct the severe imbalances—efforts that culminated in a revised agreement in early 2024 committing the Chinese-backed Sicomines consortium to $7 billion in infrastructure development—the fundamental ownership structure of the mining sites remained entirely unchanged.1 Chinese companies continue to administer the mines, extract the resources, and operate with highly favorable tax statuses, leaving the West heavily exposed.1

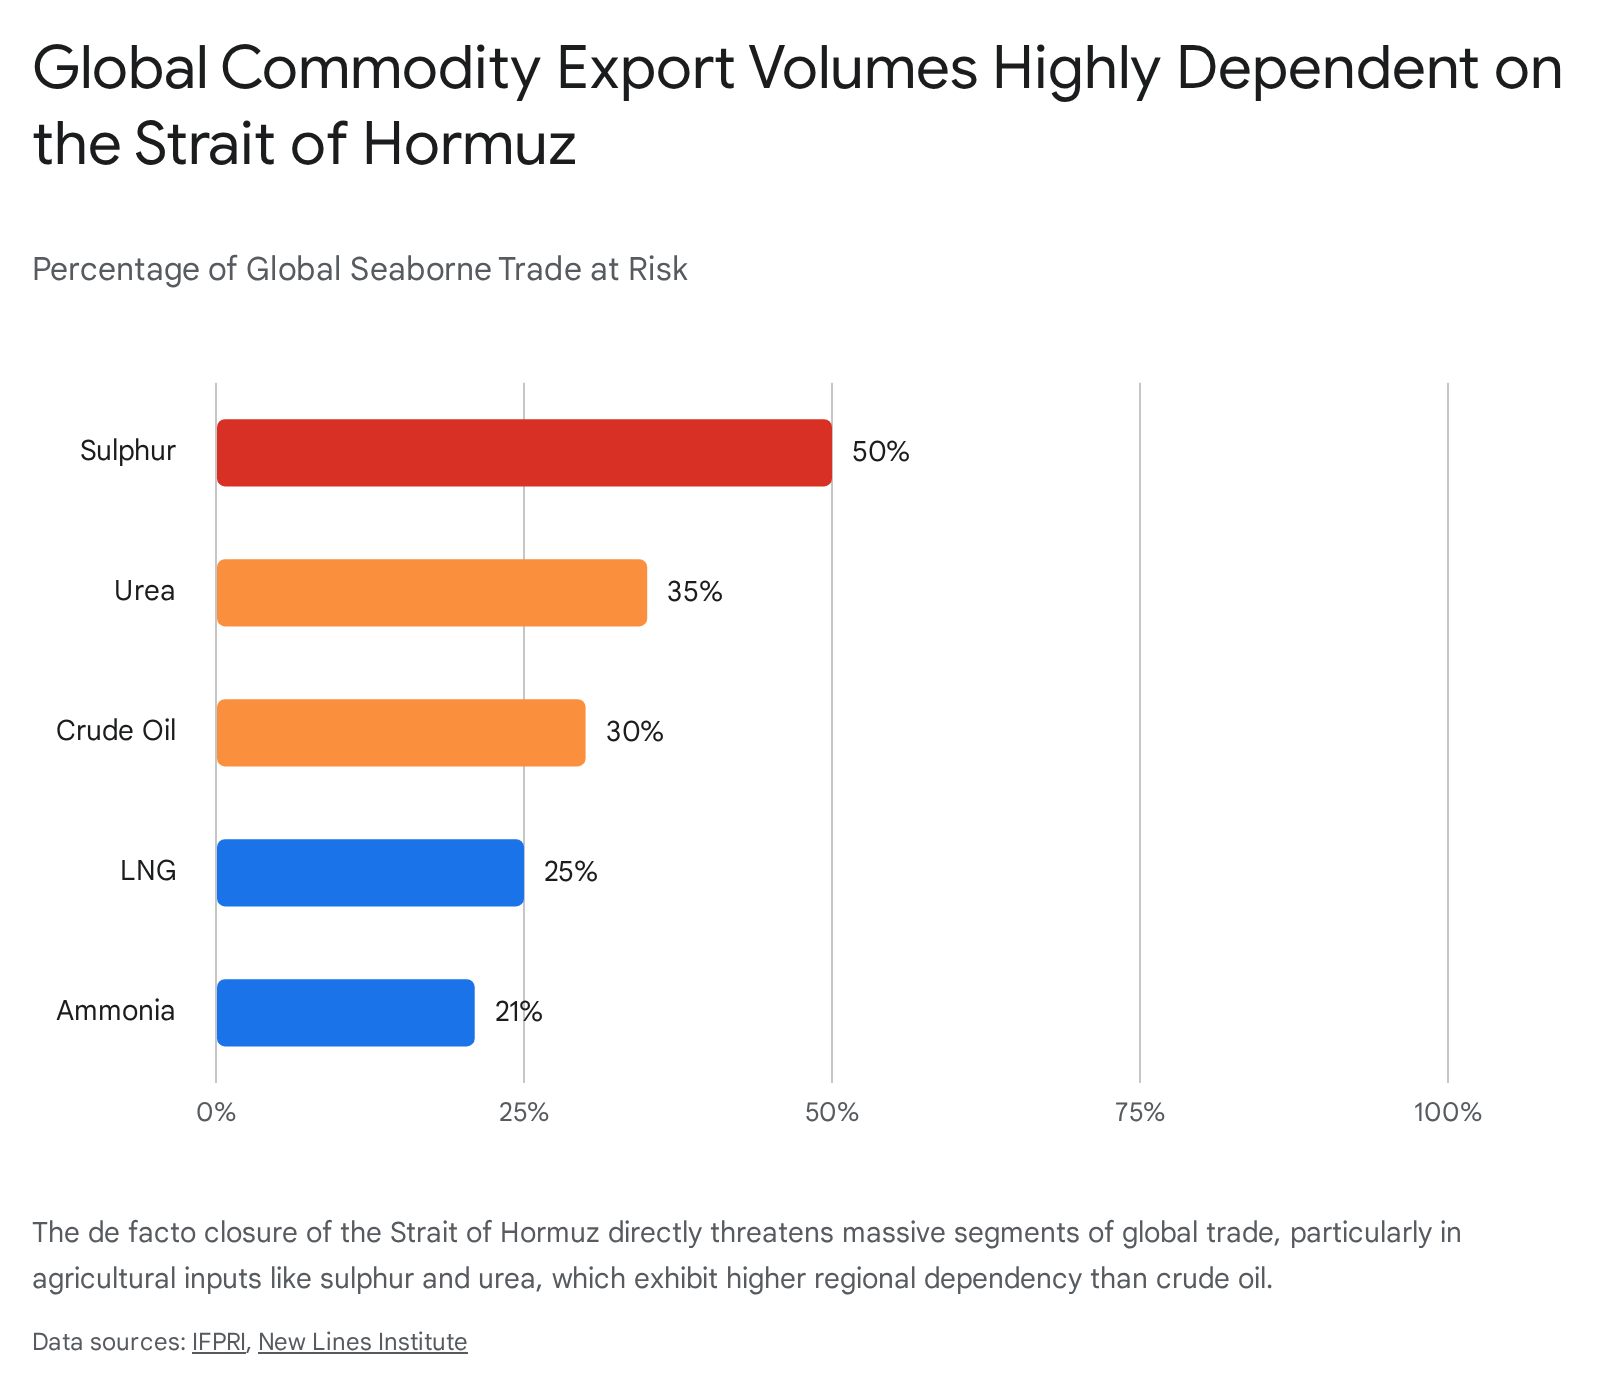
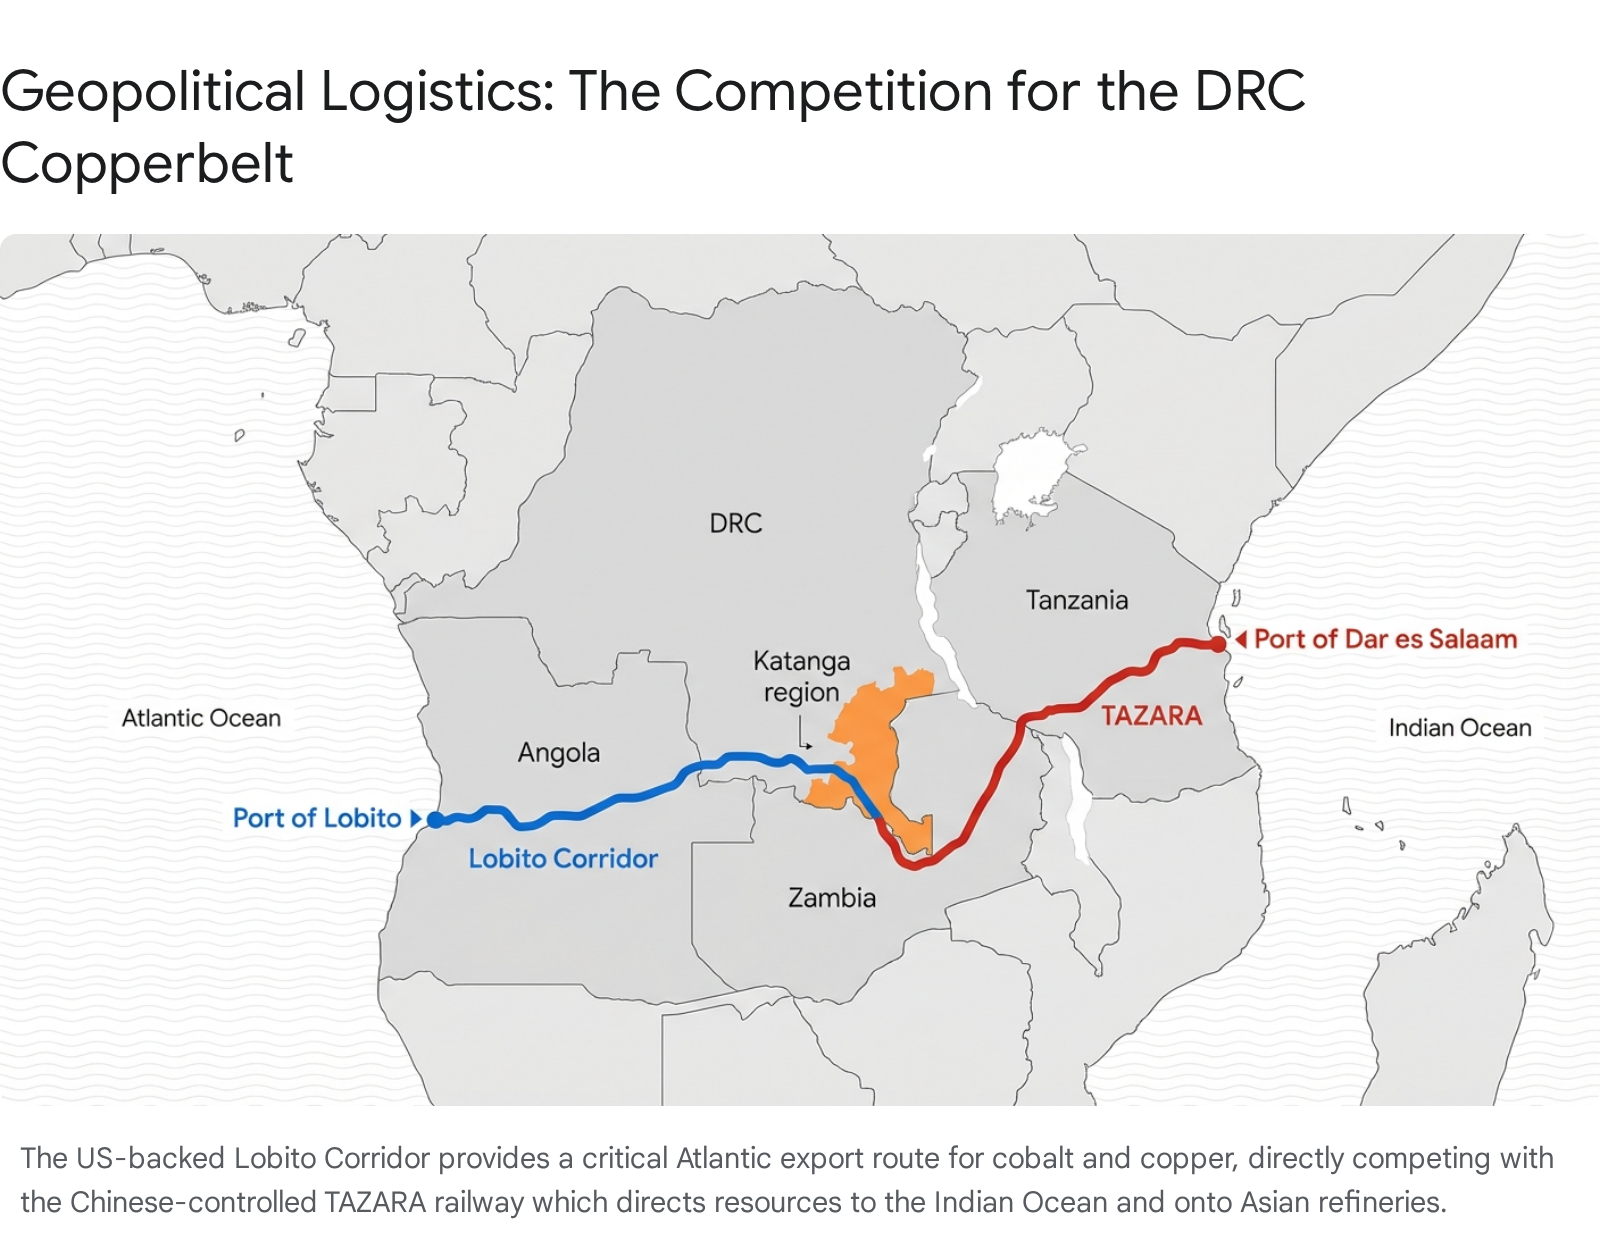
Crucially, China’s geoeconomic strategy in Central Africa extends far beyond the perimeter of the mine gate. By seamlessly linking upstream extraction to dedicated, state-financed logistics corridors, Beijing ensures the unbroken, highly efficient flow of critical minerals to its domestic refineries. The Chinese-backed modernization of the Tan-Zam (TAZARA) railway, fueled by a sweeping $1 billion investment program in exchange for operational control, facilitates the mass export of bulk minerals from the isolated Katanga region directly to the Tanzanian port of Dar es Salaam, effectively bypassing traditional, Western-accessible transport networks in southern Africa.1 Additionally, China has pursued a massive $10 billion project to modernize the Bagamoyo port in Tanzania, further securing its maritime logistics architecture.1 Consequently, an estimated 67.5 percent of China’s refined cobalt is sourced directly from the DRC, feeding a massive domestic refining apparatus that accounts for between 60 and 90 percent of global capacity.1

Evolving Diplomatic Frictions and the 2026 Shift

The strategic landscape surrounding DRC mineral rights began to shift significantly in late 2025 and early 2026, driven by a convergence of Congolese domestic politics and aggressive new U.S. foreign policy initiatives under the incoming Trump administration. Recognizing the geostrategic leverage inherent in his nation’s mineral wealth, President Tshisekedi adopted a strategy designed to play major powers against one another to maximize domestic returns.10 During the U.S. presidential transition period leading up to January 2025, Tshisekedi dispatched specialized emissaries to Washington to engage with the incoming administration, explicitly offering to assist the United States in its dual objectives of securing access to critical minerals and curtailing China’s expansionist footprint within the African supply chain.10

This diplomatic maneuvering rapidly yielded tangible results. By February 2025, with explicit encouragement from the U.S. House Foreign Affairs Committee, the Congolese government and the state mining company Gécamines took the unprecedented step of blocking a massive $1.4 billion takeover bid for Chemical of Africa (Chemaf).10 The rejected bidder was Norin Mining, a direct subsidiary of the massive Chinese state-owned weapons manufacturer Norinco.10 This rejection marked a watershed moment, signaling the DRC’s willingness to actively deny Chinese defense conglomerates further penetration into its most promising cobalt and copper projects when backed by U.S. diplomatic support.10

China's control of the DRC cobalt supply chain and global refining capacity in 2026. US countermeasures: Project Vault Strategic Reserve.

Strategic Implications for Advanced Defense Technology

The implications of this structural monopoly extend far beyond the commercial markets for consumer electronics and civilian electric vehicles; they strike directly at the core of Western defense readiness and technological superiority. In 2023, both the U.S. Department of Energy and the Department of Defense officially designated cobalt as a critical mineral, citing its indispensable applications across multiple spectrums of military technology.1

High-capacity, energy-dense batteries are increasingly vital for military logistics, the propulsion of unmanned ground and aerial vehicles, and the broad electrification of tactical platforms required for distributed operations.1 Furthermore, cobalt is a critical alloying element utilized to produce specialized superalloys. These superalloys possess extraordinary high-temperature strength, thermal stability, and unique magnetic properties, making them absolutely foundational to the manufacturing of aerospace components, including the hot sections of fighter jet engines, missile guidance systems, and advanced smart weapon actuation mechanisms.1

When a single adversarial state controls both the physical extraction of the raw material and the vast majority of its global processing capacity, it possesses the latent capability to enact targeted, devastating export controls that can paralyze the defense production lines of its strategic rivals. This is not a theoretical vulnerability; the weaponization of economic interdependence is actively deployed by Beijing through opaque environmental regulations, restrictive export licensing regimes, and state-directed production quotas that function as blunt instruments of geopolitical coercion.3 Without secure, Western-aligned access to refined cobalt and copper sourced from the DRC, the production and sustainment of next-generation Western defense platforms remains entirely subject to the strategic tolerance of the PRC.

Strategic MineralKey Defense ApplicationsStructural Vulnerability in 2026
CobaltHigh-temperature superalloys for jet engines, high-capacity tactical battery systems, smart weapon actuation.80% of DRC extraction controlled by China; up to 90% of global refining centralized in the PRC.
CopperAdvanced electrical infrastructure, radar/sensor arrays, defense microelectronics, data transmission.Heavy reliance on DRC and Chilean output; refining capacity heavily concentrated in Asia.
Samarium & GadoliniumSpecialized rare earth magnets (Sm-Co) crucial for F-35 fighter jets, THAAD, and PAC-3 missile interceptors.Near-total PRC monopoly; subject to active Chinese export licensing restrictions implemented in 2025.
Dysprosium & TerbiumHeat-resistant permanent magnets required for hypersonic glide vehicles and advanced propulsion.Constrained global supply entirely dependent on Chinese heavy rare earth metallization facilities.

Section II: Energy Infrastructure as a Sanctions Network: The Chilean Vector

The Subtle Architecture of Infrastructure Capture in South America

While the race for critical minerals heavily relies on the physical extraction and processing of resources in Africa, an equally potent and arguably more insidious form of supply chain weaponization is unfolding within the domain of critical public infrastructure. In South America, Chinese state-owned enterprises have systematically acquired controlling stakes in the energy generation, transmission, and distribution networks of key resource-rich nations, creating what defense analysts now characterize as a latent “physical sanctions network”.12

The scale and concentration of this infrastructure capture are profound. In Lima, Peru, a sprawling metropolis of 10 million people representing roughly one-third of the nation’s total population, electricity distribution is now 100 percent controlled by just two Chinese firms: China Southern Power Grid International (CSGI) and China Three Gorges Corporation.12 In Brazil, Chinese firms have poured billions of dollars into the sector, securing control over an estimated 12 percent of all national electricity transmission and distribution.12

However, the most strategically consequential penetration has occurred in Chile. Chile represents a critical node in the global energy transition, possessing vast reserves of lithium and serving as the world’s leading producer of copper.13 Despite this geoeconomic importance, Chinese companies currently control an estimated 66 percent of the country’s power distribution networks and approximately 55 percent of its electricity transmission infrastructure.12 This staggering degree of market concentration by foreign state-affiliated entities transcends conventional commercial investment; it represents a fundamental curtailment of host nation sovereignty and strategic autonomy.

The Threat to Strategic Autonomy and Industrial Reliability

Control over a nation’s energy grid dictates the operational reliability and output capacity of its entire industrial base. The vulnerability of this arrangement was vividly illustrated in February 2025, when widespread blackouts in Chile led to severe disruptions across the country’s crucial mining and industrial sectors.12 When the power grid fails, the extraction, processing, and export of the copper and lithium required by Western defense and commercial sectors grind to an immediate halt.

The strategic peril generated by this infrastructure capture is twofold. First, countries heavily dependent on foreign state-owned entities to illuminate their cities and power their economies are structurally disincentivized from aligning against those entities in broader geopolitical disputes.12 This dynamic severely curtails the options available to host governments regarding domestic industrial policy, foreign alignments, and participation in international trade consortiums. If the PRC were to weaponize this control, it could leverage the implicit threat of reduced grid efficiency, delayed maintenance, or intentional operational disruption to extract significant political concessions from Santiago or Lima.12

Second, the rapid modernization of these electrical grids introduces severe cybersecurity vulnerabilities. The widespread deployment of Chinese-supplied “smart meters”—such as the 600,000 units recently provided to neighboring Uruguay—creates entirely new vectors for cyber exploitation.12 Because these advanced meters monitor energy consumption in real-time and interface directly with national telecommunications networks, security researchers have demonstrated that they could be manipulated by hostile actors to simulate severe grid oscillations or initiate coordinated, cascading power shut-offs, effectively transforming civilian electrical infrastructure into a latent offensive military capability.12

The 2026 Chilean Political Crisis: Submarine Cables and the Kast Administration

This escalating geoeconomic tension culminated dramatically during the presidential transition to the Kast administration in Chile in early 2026. The transition of power—a historically stable bedrock of Chilean democracy since the end of the Pinochet dictatorship in 1990—was abruptly halted just days before the March 11 inauguration.16 Conservative President-elect José Antonio Kast publicly broke off transition talks with outgoing left-wing President Gabriel Boric over a highly controversial, last-minute infrastructure concession.16

The Boric government had abruptly granted a massive concession to a Chinese consortium comprising China Mobile International, China Unicom, and China Telecom to construct the “Chile-China Express” submarine fiber-optic cable.16 This project, which aimed to link the Chilean port of Valparaiso directly to Hong Kong across 20,000 kilometers of the Pacific Ocean, included manufacturing and deployment contracts awarded to HMN Tech, a firm formerly affiliated with Huawei.16

The United States explicitly identified this digital infrastructure project as a severe regional security threat, arguing that a direct Chinese cable would allow Beijing to route Latin American data traffic outside of North American visibility, deeply compromising the operational security of the hemisphere.17 In an unprecedented move against a close ally, the U.S. State Department invoked Section 212(a)(3)(C) of the Immigration and Nationality Act to impose strict visa restrictions on three Chilean government officials who had authorized the project, citing their actions as “undermining regional security”.17

President Kast, who won the election with 58.2 percent of the vote on a platform prioritizing strict security, immediate economic stabilization, and a decisive pivot toward alignment with the United States, faced a monumental challenge upon taking office on March 11, 2026.19 Kast merged the Mining and Economy ministries under single leadership to streamline investment and permitting, but he must now untangle Chile from these deep geoeconomic dependencies while maintaining the country’s status as a reliable Western supplier.14 The Kast administration’s ability to execute its economic agenda and attract U.S. capital will depend heavily on its capacity to mitigate the latent threats embedded within its own energy and digital networks.

SectorChinese Ownership/Influence in South AmericaStrategic Vulnerability
Electricity Distribution (Chile)~66% controlled by PRC state-affiliated entities.Direct exposure of copper/lithium mining operations to politically motivated grid disruptions.
Electricity Transmission (Chile)~55% controlled by PRC state-affiliated entities.Curtailed sovereign ability to dictate industrial energy policy and green transition priorities.
Power Grid (Peru)100% of Lima distribution controlled by CSGI and Three Gorges.Total capture of capital city infrastructure, creating a massive “physical sanctions” deterrent.
Telecommunications (Chile)“Chile-China Express” submarine cable concession (HMN Tech/China Mobile).Potential routing of sovereign Latin American data outside Western surveillance architectures; cyber espionage risk.

Section III: The Architecture of Western Counter-Offensives: Alliances, Near-Shoring, and Industrial Policy

Recognizing the acute, cascading vulnerabilities exposed by the PRC’s dominance in the DRC’s mineral sectors and the insidious capture of South American energy grids, the United States and the European Union have aggressively accelerated a series of structural countermeasures in 2025 and 2026. These initiatives represent a comprehensive overhaul of Western industrial policy, designed to physically bypass adversarial supply chains, aggressively stimulate domestic and allied processing capacities, and enforce geopolitical loyalty through integrated financial and trade architectures.

Physical Bypasses and Trading Structures: The Lobito Corridor and Project Orion

To immediately neutralize China’s logistical advantage in Central Africa—specifically the flow of resources eastward via the TAZARA railway to the Indian Ocean—the United States and the European Union have heavily backed the physical development of the Lobito Corridor.1 This multi-billion-dollar infrastructure initiative aims to rehabilitate and drastically expand the colonial-era Benguela railway, creating a direct, Atlantic-facing export route that physically links the mineral-rich Katanga region of the DRC and the Zambian Copperbelt directly to the deep-water port of Lobito in Angola.22

The rail system encompasses 1,289 kilometers of track within Angola and a vital 450-kilometer extension into the DRC.24 Supported by a $600 million direct pledge from U.S. President Joe Biden and a subsequent $753 million financing package largely driven by a $553 million loan from the U.S. International Development Finance Corporation (DFC), the corridor became operational in August 2024.23 By early 2026, the Lobito Atlantic Railway consortium (comprising Mota-Engil, Trafigura, and Vecturis) had increased cargo throughput to over 60 percent of its capacity, achieving an 85 percent on-time delivery reliability metric.24 By bypassing traditional, congested southern African routes through Durban and countering Chinese-controlled eastern ports, the Lobito Corridor grants Western mining entities vastly enhanced supply chain flexibility and drastically reduced transit times to Atlantic markets.24

Map of DRC Copperbelt showing Lobito Corridor (US-backed) and TAZARA railway (Chinese-controlled). Geopolitical logistics.

Complementing this physical infrastructure bypass is “Project Orion,” a sophisticated financial maneuver orchestrated by the United States. Utilizing the Orion Critical Mineral Consortium and leveraging deep partnerships with commodity trading giants like Glencore, the U.S. has secured its first major foothold in DRC copper and cobalt mines without assuming the severe sovereign and operational risks associated with direct state ownership of mining assets.9 Backed by an estimated $9 billion in aggregate frameworks and utilizing guaranteed, government-backed offtake agreements, this strategy structurally ensures that a substantial portion of the output from these specific mines will physically bypass Chinese refineries and flow directly into U.S.-aligned manufacturing networks.9

Geoeconomic Architecture: Project Vault, FORGE, and Pax Silica

The United States has rapidly moved beyond traditional diplomacy, deploying sweeping industrial policies aimed at market stabilization and strategic stockpiling. On February 2, 2026, the Trump administration officially launched Project Vault, a monumental $12 billion public-private partnership establishing the U.S. Strategic Critical Minerals Reserve.28 Backed by the largest single loan in the history of the Export-Import Bank of the United States (EXIM)—a massive $10 billion outlay—alongside $2 billion in expected private-sector capital, Project Vault represents a radically decentralized, demand-driven approach to stockpiling.28

Unlike centralized government purchasing programs, Project Vault allows original equipment manufacturers (OEMs) and defense contractors to submit lists of required minerals, committing to purchase them later at fixed prices.29 This structure covers all 60 minerals on the USGS Critical Minerals List, acting as a profound shield for domestic manufacturers against adversarial supply shocks and global price volatility.29 This is heavily augmented by the Department of Defense utilizing Defense Production Act (DPA) Title III authorities to fund domestic processing, such as a $15 million agreement with Jervois Mining for cobalt extraction in Idaho, and significant funding for REalloys to establish a “zero-China” heavy rare earth metallization facility in Ohio by 2027.1

Concurrently, the U.S. engineered the launch of FORGE (the Forum on Resource Geostrategic Engagement) at the inaugural 2026 Critical Minerals Ministerial.34 Chaired initially by the Republic of Korea and superseding the earlier Minerals Security Partnership, FORGE operates as a plurilateral coalition of 54 countries and the European Commission.32 It is designed to establish a preferential trading zone for critical minerals.36 Its most potent geoeconomic mechanism is the implementation of coordinated reference prices and strict price floors.35 By setting minimum price thresholds enforced through adjustable tariffs, FORGE aims to protect Western and allied mining ventures from the PRC’s established, predatory tactic of market manipulation—specifically, dumping cheap processed minerals onto the global market to bankrupt nascent Western competitors before they can achieve commercial scale.35

Expanding the perimeter of technological defense beyond raw materials, the U.S. formalized the Pax Silica alliance in December 2025, culminating in India joining as the tenth signatory in February 2026 alongside nations like Japan, the UK, Australia, and Israel.38 Pax Silica aggressively aligns the industrial policies of advanced economies to secure the entirety of the technology stack—from mineral extraction and advanced manufacturing to semiconductor fabrication, data centers, and AI infrastructure.38 By committing to pro-innovation frameworks, cross-border investments, and the reduction of coercive dependencies, Pax Silica explicitly attempts to isolate adversarial nodes from the critical technologies that will define the 21st century.39

The European Union’s Regulatory Shield: The Critical Raw Materials Act (CRMA)

Across the Atlantic, the European Union has operationalized its own aggressive defense mechanisms through the strict implementation of the Critical Raw Materials Act (CRMA), a cornerstone of its broader economic security strategy.43 Realizing the existential peril of its profound dependencies on foreign imports for the green and digital transitions, the EU established ambitious, legally binding benchmarks for 2030. The CRMA mandates that the EU must source at least 10 percent of its annual consumption from domestic extraction, 40 percent from domestic processing, and 25 percent from domestic recycling.44 Crucially, it dictates that no more than 65 percent of the EU’s annual consumption of any strategic material can be sourced from a single third country.44

To achieve these formidable metrics, the EU established a framework to fast-track “Strategic Projects,” offering these initiatives highly accelerated permitting timelines (maximum 27 months for extraction, 15 months for processing) and preferential access to massive public and private financing hubs.43 Following the closure of its second call for applications in early 2026, the European Commission had officially designated 47 internal Strategic Projects located within 13 Member States, and 13 external Strategic Projects located in partner nations such as Canada, Brazil, and South Africa.45

These approved projects heavily emphasize the raw materials directly applicable to both the energy transition and the resilience of the defense and aerospace sectors. The portfolios include extensive projects focusing on lithium, nickel, cobalt, and manganese for battery-grade applications, alongside critical defense inputs such as tungsten, magnesium, and rare earth elements necessary for permanent magnets.45 While institutions like the European Court of Auditors have published reports expressing deep skepticism regarding the realistic feasibility of hitting the 2030 targets—citing severe bottlenecks in domestic production, struggles to secure offtake agreements, and protracted permitting issues that still plague early-stage developments—the CRMA represents an unprecedented, structural mobilization of European statecraft designed to secure the physical inputs of its strategic autonomy.48

InitiativeLead EntityPrimary Geoeconomic ObjectiveCore Mechanism / Investment Scale
Project VaultUnited States (EXIM Bank)Shield domestic OEMs and defense contractors from supply shocks and price volatility.$12B public-private partnership; demand-driven stockpiling of 60 critical minerals with OEM commitments.
FORGEUS / Rep. of Korea / 54 NationsPrevent adversarial market manipulation and predatory pricing (dumping).Preferential trade zone; establishment of coordinated price floors and adjustable tariffs for minerals.
Pax SilicaUnited States / 9 AlliesSecure the end-to-end technology supply chain (minerals to semiconductors to AI).Plurilateral alliance protecting sensitive technologies and coordinating cross-border infrastructure investment.
EU CRMAEuropean CommissionMandate domestic capacity benchmarks and force supply chain diversification.10% extraction, 40% processing targets by 2030; accelerated permitting for 60+ designated Strategic Projects.

Section IV: The Second-Order Effects on Western Military Hardware: The “Price of Resilience”

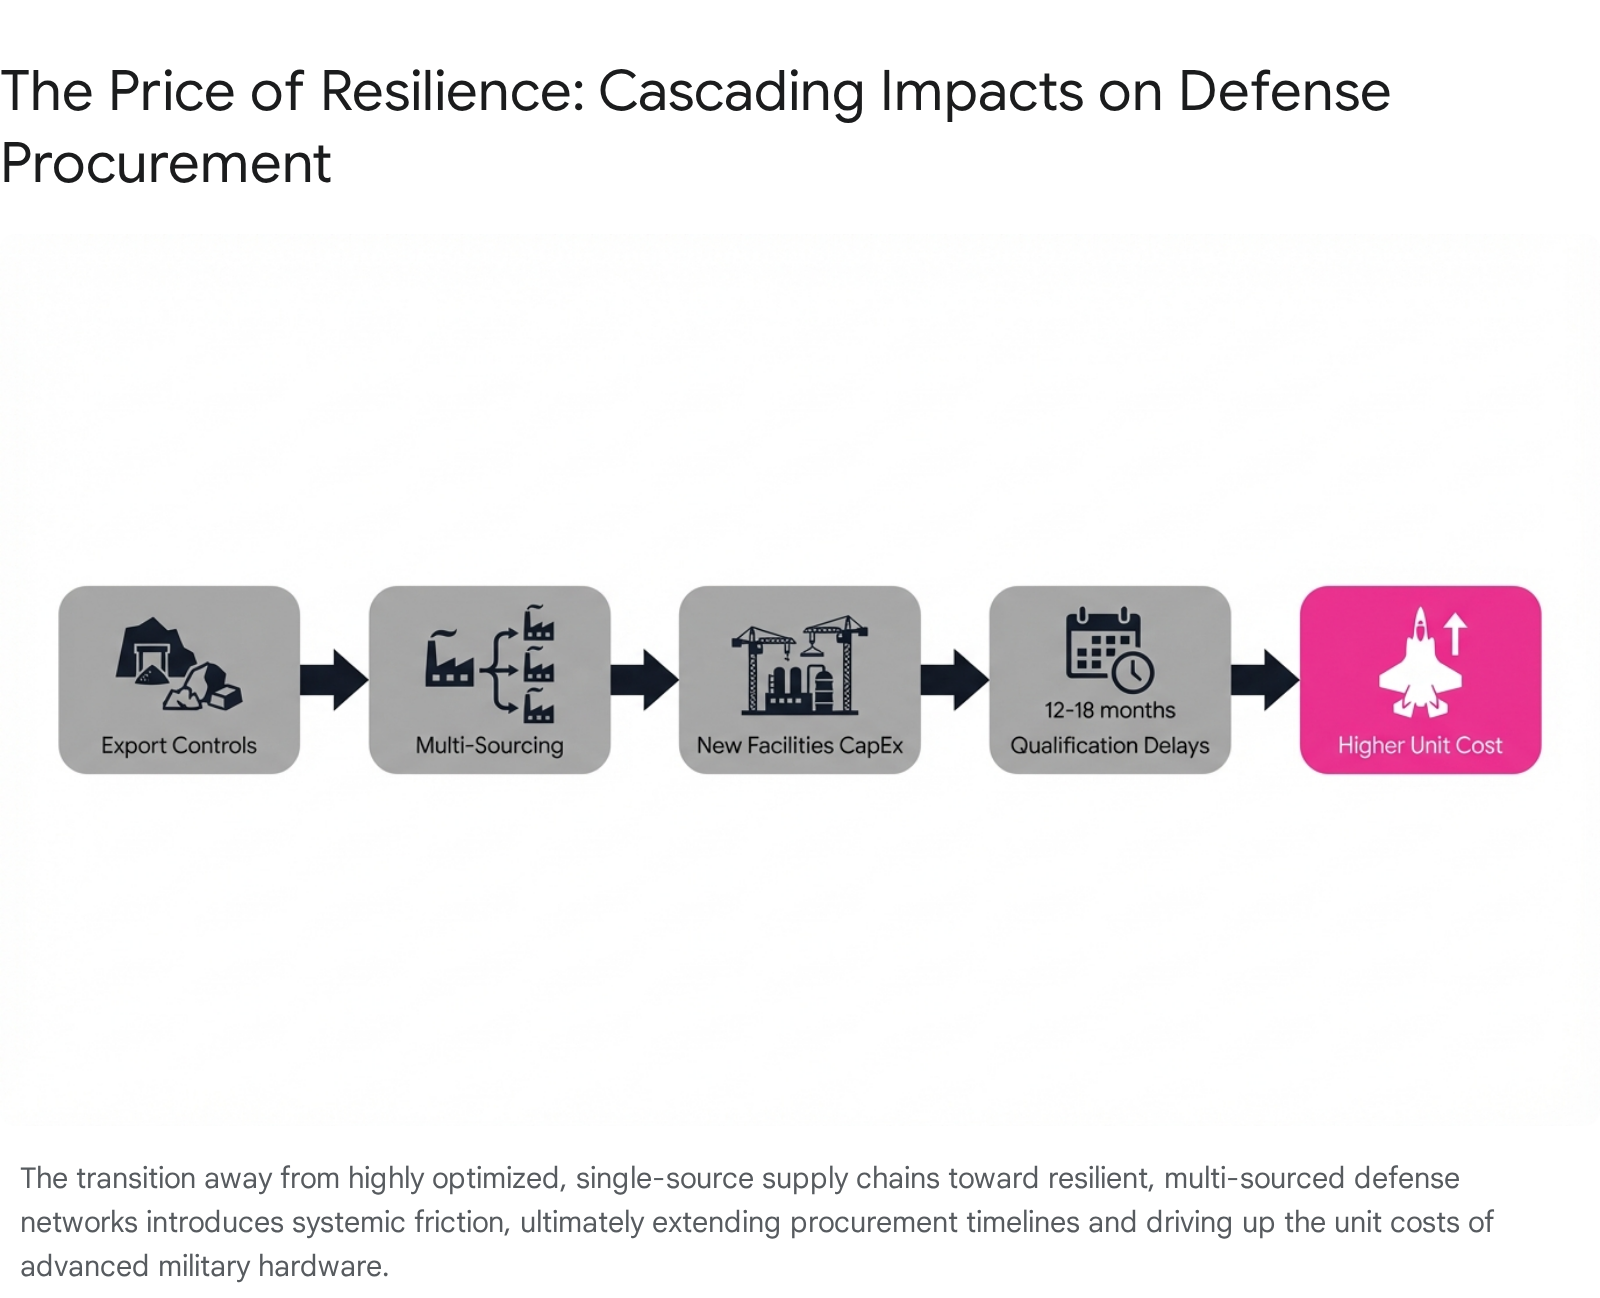
The aggressive, state-directed decoupling of defense supply chains and the rapid transition toward “friend-shoring,” near-shoring, and multi-sourcing is not a frictionless or cost-neutral endeavor. The deliberate rejection of the economically optimized, hyper-globalized trade system of the past three decades has exacted a profound, immediate toll on the Western defense industrial base. The consequence of prioritizing geopolitical reliability and national security over pure cost-efficiency is manifested in severe production delays and spiraling unit costs for advanced military hardware—a complex economic phenomenon widely categorized by analysts and finance ministers as the “price of resilience”.2

Production Timelines, Qualification Bottlenecks, and the Attrition of Readiness

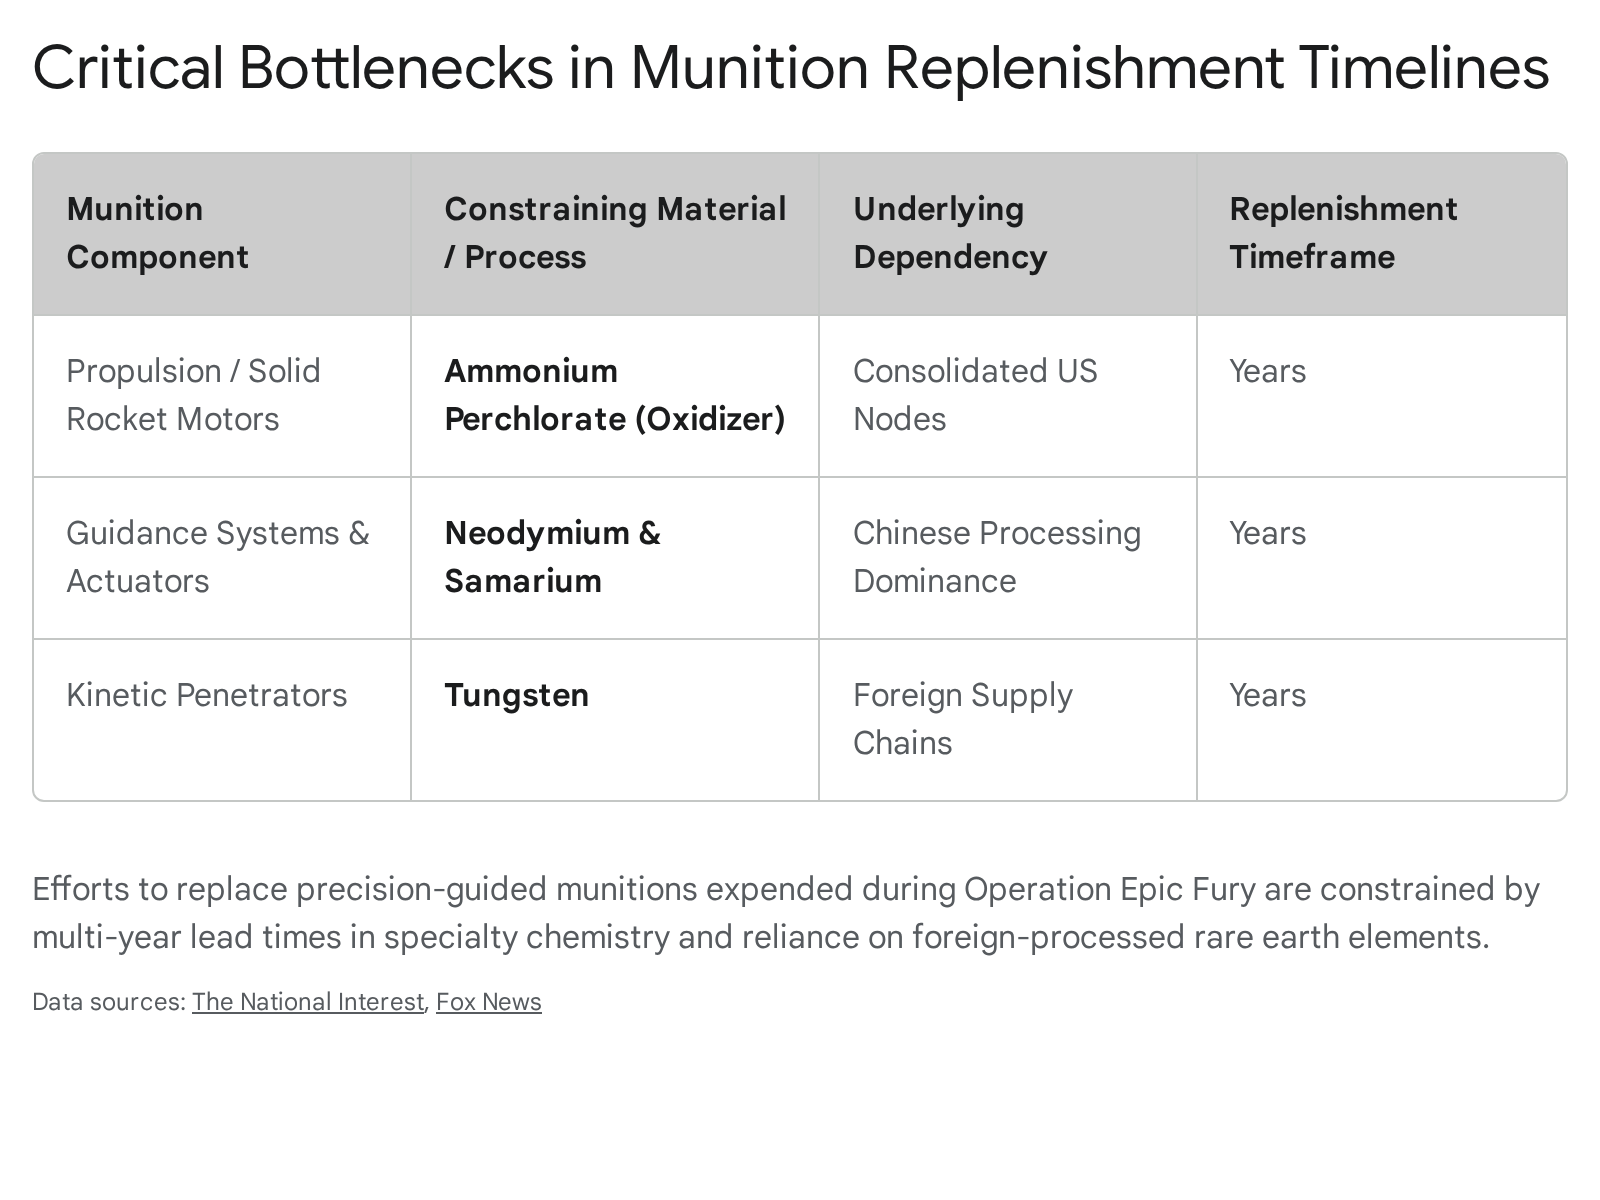
The vulnerability of modern, highly sophisticated defense platforms to even minor supply chain perturbations is staggering. Consider the F-35 Lightning II program, the absolute cornerstone of allied air superiority. Each individual F-35 airframe requires approximately 430 kilograms of specialized materials that are entirely dependent on critical mineral inputs.11 Specifically, the F-35, along with critical precision-guided munitions such as the THAAD and PAC-3 interceptors, relies absolutely on samarium-cobalt (Sm-Co) and neodymium-iron-boron (NdFeB) magnets, as well as complex gadolinium-linked rare earth alloys.49 These specific rare earth materials are non-substitutable; they are critical for maintaining extreme heat tolerance, ensuring accurate missile guidance, and powering high-performance actuation systems in combat environments.51

The supply of these materials is currently under direct threat. In April 2025, the PRC aggressively tightened export licensing controls on specific medium and heavy rare earths, explicitly including samarium and gadolinium, effectively constraining Western defense supply chains.52 Concurrently, China’s sweeping 15th Five-Year Plan (2026–2030) explicitly coupled the domestic expansion of its rare earth industry with even stricter, centralized export management systems.53

The immediate impact on the U.S. military’s operational readiness has been severe. According to reports circulating in early 2026, U.S. military stockpiles maintained a perilous buffer of only two months’ worth of rare earth supplies necessary for systems like missile guidance and fighter jet actuators, posing massive risks to sustained operations in contested theaters.54 Because the specialized infrastructure required to process minerals like yttrium and dysprosium to 99.9 percent purity at temperatures exceeding 1,200°C currently resides almost exclusively in Asia, replacing these inputs with secure, Western-aligned sources requires an arduous, highly technical qualification process.11 Consequently, relatively minor supply shocks in raw material availability now translate into devastating procurement delays lasting 12 to 18 months for critical defense systems.11

This friction is heavily exacerbated by structural inefficiencies within the U.S. defense procurement apparatus. A pivotal 2026 report by the Government Accountability Office (GAO) explicitly warned that supply chain dependencies are critically compounded by the chronic use of Continuing Resolutions (CRs) in U.S. congressional defense appropriations.55 The GAO found that operating under temporary funding constraints hampered the military’s ability to award contracts, drastically delaying the delivery and fielding of crucial equipment.55 Specifically, 36 of 74 acquisition programs surveyed reported severe schedule effects directly tied to CRs, including major modernization efforts like the F-15 Eagle Passive Active Warning Survivability System (EPAWSS).55

Furthermore, the GAO highlighted a dangerous lack of visibility; defense prime contractors often lack total visibility into supply chains that are routinely five or more tiers deep.58 This results in highly costly retroactive auditing and the forced replacement of parts when adversarial components—such as a Chinese-origin alloy discovered by Honeywell in Lockheed Martin’s F-35 engine magnets—are inevitably uncovered deep within the sub-tier manufacturing base.58

The Escalation of Capital Expenditure and Hardware Unit Costs

The second-order financial effect of supply chain weaponization is the structural, permanent elevation of defense procurement costs. The World Trade Organization (WTO) previously issued stark warnings that the fragmentation of global trade into distinct, geopolitically aligned blocs could suppress global real GDP by nearly 7 percent over the long term.2 Within the highly specialized defense sector, this macroeconomic friction is magnified.

The necessity to rapidly rebuild vertically integrated “mine-to-magnet” supply chains domestically requires immense upfront capital expenditure (CapEx).2 Initiatives like the massive heavy rare earth metallization facility being constructed by REalloys in Ohio—which guarantees a “zero-China” sourcing nexus to comply with new 2027 U.S. defense procurement standards—demand tens of millions in immediate funding and years to achieve commercial scale.33 When defense contractors are forced by legislation to abandon highly optimized, single-supplier global models in favor of redundant, multi-sourced networks located in higher-cost jurisdictions, they inherently sacrifice decades of accumulated economies of scale.2

Furthermore, the geoeconomic tools designed to protect these new industries inherently inflate costs. The implementation of price floors under the FORGE initiative, while strategically necessary to protect domestic mining from predatory Chinese dumping, artificially raises the baseline input cost of raw materials for all downstream defense manufacturers.36

The Price of Resilience: Cascading impacts on defense procurement, including export controls and higher unit costs.

The cumulative financial impact is staggering. The GAO report highlights specific instances where the cost of a contract to sustain military facilities more than doubled directly due to CR-related delays and the necessity of re-evaluating supply pipelines in a fractured market.56 As the U.S. Department of Defense imposes new, draconian procurement standards that strictly forbid adversarial sourcing for key components like samarium-cobalt magnets by January 1, 2027, defense contractors are forced to rapidly qualify new, more expensive suppliers to meet compliance deadlines.33

This heavily compressed timeline forces the military establishment to absorb massive premium pricing to guarantee delivery. Consequently, the unit costs of highly complex systems like the F-35—which had previously benefited from slowly descending cost curves achieved through mass volume production and globalized sourcing—are now facing severe, structural upward pressure.58 The fundamental economics of their material inputs have been forcibly restructured by state policy. The integration of geopolitical risk premiums into capital expenditure decisions and supply chain design means that structurally higher military budgets, prolonged delivery timelines, and persistent supply bottlenecks are no longer temporary anomalies; they are the inescapable baseline reality for Western nations operating in the 2026 multipolar environment.2

Conclusion

The geoeconomic landscape of 2026 is defined by the absolute weaponization of critical supply chains. The foundational assumption of the late 20th century—that global markets will inherently and rationally allocate resources based on price, efficiency, and comparative advantage—has been entirely shattered by the reality of state-directed monopolies, predatory pricing, and the strategic preclusion of defense-critical materials.

The PRC’s deep entrenchment in the cobalt and copper extraction sectors of the Democratic Republic of the Congo, coupled with its overwhelmingly commanding ownership of global midstream refining capacity, has exposed catastrophic vulnerabilities within the Western defense industrial base. Simultaneously, the aggressive penetration of Chinese state-owned enterprises into the critical energy grids of South America, prominently highlighted by the severe political frictions currently confronting the Kast administration in Chile, clearly demonstrates that public infrastructure itself is being actively leveraged as a latent, physical sanctions network capable of totally undermining sovereign strategic autonomy.

The sweeping architectural responses executed by the United States and the European Union—ranging from the physical logistics bypass of the Lobito Corridor to the complex geoeconomic mechanisms of Project Vault, Pax Silica, FORGE, and the European CRMA—represent a monumental, albeit historically belated, mobilization of Western statecraft. However, this desperate pursuit of strategic resilience carries a profound and unavoidable cost. By forcing the decoupling of deeply integrated global supply chains and mandating the creation of redundant, multi-sourced networks, Western nations have triggered severe secondary economic and operational effects.

The F-35 Lightning II program, advanced missile interceptor systems, and next-generation aerospace platforms are now fundamentally subject to extended procurement delays lasting up to 18 months, alongside rapidly escalating unit costs. This occurs as the defense sector absorbs the immense friction of replacing highly optimized, adversarial inputs with nascent, heavily subsidized domestic capacity. Ultimately, successfully navigating the 2026 multipolar environment requires a sobering acceptance among Western policymakers that resource security is fundamentally an issue of industrial capability rather than mere geological endowment. As defense departments aggressively recalibrate to face the harsh realities of great power competition, this “price of resilience” will dictate the scope, speed, and financial viability of military modernization for the foreseeable future.


Please share the link on Facebook, Forums, with colleagues, etc. Your support is much appreciated and if you have any feedback, please email us in**@*********ps.com. If you’d like to request a report or order a reprint, please click here for the corresponding page to open in new tab.


Sources Used

  1. China in the Democratic Republic of the Congo: A New Dynamic in …, accessed March 14, 2026, https://ssi.armywarcollege.edu/SSI-Media/Recent-Publications/Article/3938204/china-in-the-democratic-republic-of-the-congo-a-new-dynamic-in-critical-mineral/
  2. The Weaponisation of Trade Is Transforming Global Supply Chains, accessed March 14, 2026, https://internationalbanker.com/finance/the-weaponisation-of-trade-is-transforming-global-supply-chains/
  3. Choke Points: Critical Minerals and Irregular Warfare in the Gray Zone, accessed March 14, 2026, https://irregularwarfare.org/articles/choke-points-critical-minerals-and-irregular-warfare-in-the-gray-zone/
  4. US Critical Minerals Supply Chain Resiliency Guide – Discovery Alert, accessed March 14, 2026, https://discoveryalert.com.au/resource-independence-strategies-critical-minerals-2026/
  5. Trump’s critical minerals meet: Who’s attending, what’s at stake? – Al Jazeera, accessed March 14, 2026, https://www.aljazeera.com/economy/2026/2/4/trumps-critical-minerals-meet-whos-attending-whats-at-stake
  6. Financial Tools for Boosting Resilience of CRM Value Chains and Strategic Stockpiling – Ifri, accessed March 14, 2026, https://www.ifri.org/sites/default/files/2026-02/ifri_eyl-mazzega_donnen_et_michel_financing_stockpilling_march2026.pdf
  7. Nature-positive rare earth governance: Japan’s strategy in a China-dominated system – DOI, accessed March 14, 2026, https://doi.org/10.1016/j.resourpol.2026.105852
  8. US challenges Chinese control in race for African minerals – CNBC Africa, accessed March 14, 2026, https://www.cnbcafrica.com/2026/us-challenges-chinese-control-in-race-for-african-minerals
  9. Inside the $9 billion U.S.-backed critical minerals deal in DRC and what it means for China, accessed March 14, 2026, https://www.mexc.com/news/886644
  10. Can the DRC Leverage U.S.-China Competition Over Critical Minerals for Peace?, accessed March 14, 2026, https://carnegieendowment.org/russia-eurasia/research/2025/03/can-the-drc-leverage-us-china-competition-over-critical-minerals
  11. Critical Minerals Meeting in US: Transforming Global Supply Security – Discovery Alert, accessed March 14, 2026, https://discoveryalert.com.au/critical-minerals-national-security-2026/
  12. Power Moves: How China’s Energy Investments Provide Durable …, accessed March 14, 2026, https://www.csis.org/analysis/power-moves-how-chinas-energy-investments-provide-durable-influence-south-america
  13. Mineral Commodity Summaries 2026 – USGS Publications Warehouse, accessed March 14, 2026, https://pubs.usgs.gov/periodicals/mcs2026/mcs2026.pdf
  14. Chile mining sector faces policy test under Kast government, accessed March 14, 2026, https://www.miningreporters.com/noticia/news/2026/03/chile-mining-sector-policy-test-kast-government
  15. Chinese Control of Critical Energy Infrastructure in Chile – Tearline.mil, accessed March 14, 2026, https://www.tearline.mil/public_page/chinese-control-of-critical-energy-infrastructure-in-chile
  16. What’s Behind the Submarine Cables Tying Up Chile’s Presidential Transition, accessed March 14, 2026, https://chinaglobalsouth.com/analysis/chile-submarine-cable-china-us-kast-transition/
  17. The Chinese Cable That Could Trip up Chile’s New Leader, accessed March 14, 2026, https://chinaglobalsouth.com/analysis/china-chile-undersea-cable-us-china-rivalry-kast/
  18. Visa Restrictions on Chilean Nationals Undermining Regional Security, accessed March 14, 2026, https://www.state.gov/releases/office-of-the-spokesperson/2026/02/visa-restrictions-on-chilean-nationals-undermining-regional-security
  19. First hundred days: How Kast can accelerate US investment in Chile – Atlantic Council, accessed March 14, 2026, https://www.atlanticcouncil.org/in-depth-research-reports/issue-brief/first-hundred-days-how-kast-can-accelerate-us-investment-in-chile/
  20. Chile’s new president to signal swift alignment with Trump – The Japan Times, accessed March 14, 2026, https://www.japantimes.co.jp/news/2026/03/12/world/politics/chile-president-alignment-trump/
  21. Chile’s Kast takes office pledging security crackdown and migration curbs – bne IntelliNews, accessed March 14, 2026, https://www.intellinews.com/chile-s-kast-takes-office-pledging-security-crackdown-and-migration-curbs-431209/?source=chile
  22. Joint Statement Declaration of Intent from the United States Government and the European Commission on the Lobito Corridor and Investment in the Great Lakes Region – U.S. Embassy to Angola and Sao Tome and Principe, accessed March 14, 2026, https://ao.usembassy.gov/joint-statement-declaration-of-intent-from-the-united-states-government-and-the-european-commission-on-the-lobito-corridor-and-investment-in-the-great-lakes-region/
  23. Understanding the Lobito Corridor: Infrastructure, Minerals and Trade – PACT, accessed March 14, 2026, https://africanpact.org/2026/02/04/understanding-the-lobito-corridor/
  24. Lobito Atlantic Railway Transforms Africa’s Critical Mineral Supply Chains – Discovery Alert, accessed March 14, 2026, https://discoveryalert.com.au/critical-mineral-supply-chain-architecture-2026/
  25. What to know about the Lobito Corridor—and how it may change how minerals move, accessed March 14, 2026, https://www.atlanticcouncil.org/blogs/africasource/what-to-know-about-the-lobito-corridor-and-how-it-may-change-how-minerals-move/
  26. US and EU critical minerals project could displace thousands in DRC – report | Democratic Republic of the Congo | The Guardian, accessed March 14, 2026, https://www.theguardian.com/world/2025/dec/04/us-eu-critical-minerals-project-drc-report-lobito-corridor
  27. 2023 Report – Perenco, accessed March 14, 2026, https://www.perenco.com/wp-content/uploads/2024/07/2023-ESG-Report-.pdf
  28. Project Vault: What the New Critical Minerals Reserve Means for Energy and Manufacturing Companies, accessed March 14, 2026, https://www.jdsupra.com/legalnews/project-vault-what-the-new-critical-7377088/
  29. Critical Minerals: “Project Vault” and the New US Critical Minerals Playbook, accessed March 14, 2026, https://www.jdsupra.com/legalnews/critical-minerals-project-vault-and-the-9160188/
  30. Week in Review: Project Vault and the U.S. Strategic Critical Mineral Reserve | EXIM.GOV, accessed March 14, 2026, https://www.exim.gov/news/week-review-project-vault-and-strategic-critical-mineral-reserve
  31. Project Vault and FORGE: The Administration’s Latest Moves to Secure Critical Minerals, accessed March 14, 2026, https://bipartisanpolicy.org/article/project-vault-and-forge-the-administrations-latest-moves-to-secure-critical-minerals/
  32. Project Vault and FORGE Signal Next Phase of U.S. Critical Minerals Policy | Brownstein, accessed March 14, 2026, https://www.bhfs.com/insight/project-vault-and-forge-signal-next-phase-of-u-s-critical-minerals-policy/
  33. REalloys Inc. Announces Plans for Largest U.S. Heavy Rare Earth Metallization Facility with Zero-China Nexus, Targeting Initial Operations in 2027, accessed March 14, 2026, https://www.quiverquant.com/news/REalloys+Inc.+Announces+Plans+for+Largest+U.S.+Heavy+Rare+Earth+Metallization+Facility+with+Zero-China+Nexus%2C+Targeting+Initial+Operations+in+2027
  34. Critical Minerals Ministerial Introduces New International Cooperation Strategy – CSIS, accessed March 14, 2026, https://www.csis.org/analysis/critical-minerals-ministerial-introduces-new-international-cooperation-strategy
  35. US critical minerals policy goes collaborative with FORGE – Atlantic Council, accessed March 14, 2026, https://www.atlanticcouncil.org/dispatches/us-critical-minerals-policy-goes-collaborative-with-forge/
  36. ‘FORGE’-ing ahead to protect critical mineral supply chains in the US, accessed March 14, 2026, https://ceramics.org/ceramic-tech-today/forum-on-resource-geostrategic-engagement/
  37. Critical Minerals in the Crosshairs: Navigating U.S. Supply Chain Policy and Global Competition – FTI Strategic Communications, accessed March 14, 2026, https://fticommunications.com/critical-minerals-navigating-us-supply-chain-policy-and-global-competition/
  38. Pax Silica: alliances, frontier and markets in the geopolitics of the chip – Real Instituto Elcano, accessed March 14, 2026, https://www.realinstitutoelcano.org/en/analyses/pax-silica-alliances-frontier-and-markets-in-the-geopolitics-of-the-chip/
  39. Pax Silica – United States Department of State, accessed March 14, 2026, https://www.state.gov/pax-silica
  40. United States and India Sign Pax Silica Declaration, accessed March 14, 2026, https://www.state.gov/releases/office-of-the-spokesperson/2026/02/united-states-and-india-sign-pax-silica-declaration
  41. US Inaugurates Pax Silica With Seven Allies, accessed March 14, 2026, https://bowergroupasia.com/us-inaugurates-pax-silica-with-seven-allies/
  42. Pax Silica – Wikipedia, accessed March 14, 2026, https://en.wikipedia.org/wiki/Pax_Silica
  43. Strategic projects on critical raw materials gain momentum in second selection round for potential funding and faster permitting, accessed March 14, 2026, https://single-market-economy.ec.europa.eu/news/strategic-projects-critical-raw-materials-gain-momentum-second-selection-round-potential-funding-and-2026-01-19_en
  44. Critical Raw Materials Act – Internal Market, Industry, Entrepreneurship and SMEs, accessed March 14, 2026, https://single-market-economy.ec.europa.eu/sectors/raw-materials/areas-specific-interest/critical-raw-materials/critical-raw-materials-act_en
  45. Strategic Projects for the EU: list of 47 Strategic Projects announced | White & Case LLP, accessed March 14, 2026, https://www.whitecase.com/insight-alert/strategic-projects-eu-list-47-strategic-projects-announced
  46. EU Designates 13 Non-EU Critical Raw Materials Projects as Strategic | Global Policy Watch, accessed March 14, 2026, https://www.globalpolicywatch.com/2025/06/eu-designates-13-non-eu-critical-raw-materials-projects-as-strategic/
  47. Selected strategic projects under CRMA, accessed March 14, 2026, https://single-market-economy.ec.europa.eu/sectors/raw-materials/areas-specific-interest/critical-raw-materials/strategic-projects-under-crma/selected-projects_en
  48. Special report 04/2026: Critical raw materials for the energy transition | European Court of Auditors, accessed March 14, 2026, https://www.eca.europa.eu/en/publications?ref=SR-2026-04
  49. Press Release – MINING.COM, accessed March 14, 2026, https://www.mining.com/press-release?id=69b01adf4d39924d679c2881
  50. Trump’s Secret Weapon in the Rare Earth War – MineralPrices.com, accessed March 14, 2026, https://mineralprices.com/trumps-secret-weapon-in-the-rare-earth-war/
  51. Ucore Accelerates Commercial Planning for Samarium and Gadolinium Oxides as Defense Supply Chains Face Urgent Shortages, accessed March 14, 2026, https://ucore.com/ucore-accelerates-commercial-planning-for-samarium-and-gadolinium-oxides-as-defense-supply-chains-face-urgent-shortages/
  52. Ucore Accelerates Commercial Planning for Samarium and Gadolinium Oxides as Defense Supply Chains Face Urgent Shortages – Stock Titan, accessed March 14, 2026, https://www.stocktitan.net/news/UURAF/ucore-accelerates-commercial-planning-for-samarium-and-gadolinium-1ichw522931r.html
  53. US has two months of rare earth supplies left, SCMP reports, accessed March 14, 2026, https://www.mining.com/us-has-two-months-of-rare-earth-supplies-left-scmp-reports/
  54. US rare earth two‑month buffer: supply‑chain risks for defence projects, accessed March 14, 2026, https://www.geomechanics.io/news/article/us-rare-earth-twomonth-buffer-supplychain-risks-for-defence-projects
  55. GAO-26-107065, DEFENSE BUDGET: Effects of Continuing Resolutions on Selected Activities and Programs Critical to DOD’s Nationa, accessed March 14, 2026, https://www.gao.gov/assets/gao-26-107065.pdf
  56. Defense Budget: Effects of Continuing Resolutions on Selected Activities and Programs Critical to DOD’s National Security Mission [Reissued with revisions on Feb. 4, 2026] – GAO, accessed March 14, 2026, https://www.gao.gov/products/gao-26-107065
  57. DoD Delays, Increased Costs A Result of Continuing Resolutions, GAO Report Finds, accessed March 14, 2026, https://www.nationaldefensemagazine.org/articles/2026/1/22/dod-delays-increased-costs-a-result-of-continuing-resolutions-gao-report-finds
  58. The U.S. Defense Industrial Base | The Heritage Foundation, accessed March 14, 2026, https://www.heritage.org/military-strength/topical-essays/the-us-defense-industrial-base
  59. REalloys (NASDAQ: ALOY) Announces Fully Financed Buildout of the Largest Heavy Rare Earth Metallization Facility Outside China, in Partnership with the Saskatchewan Research Council, accessed March 14, 2026, https://markets.businessinsider.com/news/stocks/realloys-nasdaq-aloy-announces-fully-financed-buildout-of-the-largest-heavy-rare-earth-metallization-facility-outside-china-in-partnership-with-the-saskatchewan-research-council-1035918247
  60. The Pentagon’s Most Important Tech is No Longer “Made in China” – Nasdaq, accessed March 14, 2026, https://www.nasdaq.com/press-release/pentagons-most-important-tech-no-longer-made-china-2026-03-03
  61. Russia and China Are Running in a Nuclear Arms Race | The Heritage Foundation, accessed March 14, 2026, https://www.heritage.org/defense/commentary/russia-and-china-are-running-nuclear-arms-race
  62. $3.7 Billion: Estimated Cost of Epic Fury’s First 100 Hours – CSIS, accessed March 14, 2026, https://www.csis.org/analysis/37-billion-estimated-cost-epic-furys-first-100-hours

Impact of the 2026 Gulf War on Global Supply Chains

1. Executive Overview and Geopolitical Context

The outbreak of the third Gulf War on February 28, 2026, initiated by joint United States and Israeli military operations under the designation Operation Epic Fury, has fundamentally altered the global economic and security landscape.1 The opening salvos targeted and eliminated key Iranian leadership figures, including Supreme Leader Ali Khamenei, which triggered a massive retaliatory wave of Iranian ballistic missiles and drone strikes across the Middle East.1 These retaliatory strikes have engaged military installations and deeply compromised civilian infrastructure, energy hubs, and commercial maritime routes across the Gulf Cooperation Council states, including the United Arab Emirates, Bahrain, Qatar, Kuwait, and Saudi Arabia.3

The defining geoeconomic consequence of the conflict thus far is the de facto closure of the Strait of Hormuz. While Iranian naval assets in the Gulf of Oman have suffered significant degradation from United States Central Command operations, the combination of kinetic drone strikes, elevated war risk insurance premiums, and massive electronic warfare operations has brought commercial transit to a virtual standstill.5 By early March 2026, maritime traffic through the Strait had plummeted by nearly 80 percent, with daily transits dropping from an average of 153 to as few as three per day.6 Advanced tracking indicates that automatic identification system signals are being heavily jammed or spoofed, causing vessels to cluster in holding patterns near Fujairah and the Gulf of Oman to avoid collision and missile threats.6

Foreign affairs and national security analysts observe that the crisis extends far beyond a bilateral military exchange. The conflict has exposed a fragmenting regional order where global powers are maneuvering for leverage. Intelligence reports suggest that Russia is sharing intelligence with Iran to support strikes against United States forces, highlighting a deepening cooperation between adversaries.8 Simultaneously, China is reportedly negotiating directly with Tehran for safe passage of its tankers through the closed strait, underscoring Beijing’s deep reliance on Middle Eastern energy.9 Inside Iran, the assassination of leadership has led to a succession crisis and the establishment of a ruling triumvirate, further complicating diplomatic off ramps.10

The resulting supply chain shock is unprecedented in its speed and scope. The Middle East remains the heart of the global energy and petrochemical system. The constriction of the Strait of Hormuz directly threatens 20 percent of the world’s daily oil supply, large segments of global liquefied natural gas exports, and massive portions of the global fertilizer and petrochemical trades.11 Consequently, global commodity markets have entered a state of extreme volatility. Energy, agricultural inputs, and industrial metals are experiencing sharp price spikes as buyers scramble to secure alternative sources.12 This report details the extent of the supply chain shocks across the top 10 most directly impacted industries, identifies regions with the capacity to absorb the displaced demand, and forecasts the timeframes required for alternative capacities to come online.

2. Macroeconomic Shifts and Systemic Trade Ruptures

The current conflict represents a structural geoeconomic rupture rather than a temporary logistical hurdle. The disruption of the Persian Gulf activates severe inflationary pressures across global supply chains. Economic analysis indicates that for energy importing powerhouses such as China and India, the sudden loss of Middle Eastern crude, liquefied natural gas, and chemical feedstocks drives up production costs for energy intensive manufacturing sectors.11 This input inflation squeezes profit margins and threatens global export competitiveness.11

Furthermore, the conflict has exposed the limitations of regional air defense architecture. While Gulf Cooperation Council states utilizing United States supplied Terminal High Altitude Area Defense systems and Patriot PAC-3 MSE interceptors have reported high interception rates against traditional ballistic missiles, the sheer volume of low cost Iranian Shahed drones has proven difficult to mitigate entirely.13 Debris from interceptions and direct hits have caused material damage to vital infrastructure, forcing companies like QatarEnergy and Aluminium Bahrain to declare force majeure on shipments.16

The resulting systemic trade rupture forces a rapid recalibration of global sourcing. Industries reliant on just in time delivery models for metals, chemicals, and fertilizers are now facing weeks of delays and exponentially higher freight costs.18 The global economy is pivoting toward a prioritization of supply chain resilience over pure cost efficiency, accelerating investments in alternative energy regions, domestic manufacturing, and green technologies.11

Strait of Hormuz commodity export dependency: Sulphur 50%, Urea 35%, Crude Oil 30%, LNG 25%, Ammonia 21%

3. Analysis of Top 10 Directly Impacted Industries

The 2026 Iranian Gulf War has created immediate supply deficits across multiple sectors. Energy sector and macroeconomic analysis provides a detailed examination of the top 10 most directly impacted industries, detailing the extent of the shock, alternative global capacities, and the realistic timeframes for market stabilization.

3.1. Crude Oil Markets and Global Petroleum Supply

The Middle East accounts for roughly 30 percent of global oil production and nearly half of all global seaborne oil exports.11 The closure of the Strait of Hormuz effectively traps nearly 20 million barrels per day inside the Persian Gulf.11 Consequently, crude oil prices reacted violently in the opening days of the war. Brent crude surged past the $100 per barrel threshold, eventually reaching peaks near $126 per barrel amid fears of prolonged shortages.20

While Saudi Arabia maintains some alternative export routes via Red Sea pipelines, elevated attacks by regional proxy groups have historically constrained these corridors.22 The burden of replacing this monumental supply deficit falls primarily on non OPEC+ producers in the Americas. Global supply growth is projected to be driven heavily by countries outside the immediate conflict zone, though the timeline for this capacity to offset the crisis varies significantly.23

Alternative Capacity and Activation Timeframes

The United States, Canada, Guyana, and Brazil hold the greatest capacity to bridge the supply gap, though their production increases are structural rather than immediate.

  • United States: The United States is forecast to lead global production growth, adding approximately 1.1 million barrels per day of capacity between 2024 and 2026.24 This growth is primarily driven by efficiencies in the Permian Basin in Texas and New Mexico.25 In December 2025, United States crude oil production hovered around 13.6 million barrels per day.26
  • Canada: Canadian production is set to increase by 0.5 million barrels per day by 2026.23 This growth is heavily supported by the Trans Mountain pipeline expansion, which adds 600,000 barrels per day of takeaway capacity to the Pacific coast.23 However, analysts note that by late 2026, pipeline constraints could reappear, potentially exerting downward pressure on local pricing.27
  • Brazil and Guyana: Offshore deepwater projects in South America are yielding significant output. Brazil is forecast to add 0.3 million to 0.48 million barrels per day by 2026, utilizing new floating production storage and offloading vessels.23 Notably, the startup of Equinor’s Bacalhau field has pushed Brazilian monthly production above 4.0 million barrels per day.28 Guyana is adding another 0.3 million barrels per day, bolstered by the Uaru development project expected to come online in 2026 following the success of the Yellowtail project.23
  • Argentina: Shale production from Argentina’s Vaca Muerta region increased to over 500,000 barrels per day in 2025.23 Argentina is estimated to grow its production by another 130,000 barrels per day in 2026 as local takeaway capacity bottlenecks are resolved.23
  • Venezuela: While Venezuela holds massive reserves, its capacity to rapidly pick up demand is severely restricted by deteriorated infrastructure, environmental compliance issues, and a lack of skilled labor.29 Venezuelan output will not immediately offset Gulf losses in 2026. However, if sanctions ease and transitional governance stabilizes the sector, heavy sour crude production could rise to over 1 million barrels per day between 2027 and 2030, and potentially up to 2.5 million barrels per day in the long term.30
Producing NationProjected Capacity Addition (2024 to 2026)Primary Growth DriverConstraint or Bottleneck
United States+ 1.1 million barrels per dayPermian Basin efficiencyCapital discipline and natural depletion in older basins
Canada+ 0.5 million barrels per dayTrans Mountain Pipeline expansionLooming pipeline capacity limits by late 2026
Brazil+ 0.3 to 0.48 million barrels per dayDeepwater offshore vesselsHigh upfront costs and long development timelines
Guyana+ 0.3 million barrels per dayUaru offshore development projectInfrastructure scaling
Argentina+ 0.13 million barrels per dayVaca Muerta shale expansionMidstream takeaway capacity
VenezuelaNegligible in 2026Sanctions relief and transitional governanceSevere infrastructure decay and labor shortages

In the short term, global markets must rely on strategic petroleum reserves and demand destruction caused by high prices. Meaningful alternative physical barrels from the Americas will continue to ramp up through the end of 2026, but they cannot fully replace a sustained physical blockade of the Persian Gulf.31 The resulting feedback loop of excess supply pressures in the Americas versus extreme deficits in Eurasia will create a highly fractured global oil market.

3.2. Liquefied Natural Gas Production and Distribution

The Middle East produces approximately 18 percent of the world’s natural gas and accounts for 20 to 30 percent of global liquefied natural gas exports.11 Qatar alone is responsible for nearly 20 percent of global liquefied natural gas supply.16 Following Iranian attacks on industrial centers and the closure of the Strait of Hormuz, QatarEnergy declared force majeure on all liquefied natural gas shipments in early March 2026.16 This massive supply extraction caused global natural gas prices to surge by over 40 percent, exacerbating an existing global gas market deficit.11

The disruption is particularly acute for European and Asian markets that heavily depend on continuous seaborne gas deliveries to fuel power grids and industrial heating operations. The sudden loss of Qatari volumes forces these regions to compete aggressively in the spot market for uncontracted cargoes.

Alternative Capacity and Activation Timeframes

The United States and Canada are the primary regions positioned to absorb this displaced demand, fueled by a wave of new export terminal completions and massive contracting activity. In 2025 alone, United States developers signed sale and purchase agreements for 40 million tons per annum of liquefied natural gas, equal to 5.2 billion cubic feet per day.33

  • United States Gulf Coast: United States capacity is expanding aggressively. The Department of Energy recently approved a 12 percent expansion at Cheniere Energy’s Corpus Christi terminal in Texas, raising its authorized export capacity to 4.45 billion cubic feet per day and making it the second largest export project in the nation.34 Furthermore, projects such as Plaquemines Phase 2 and Golden Pass are actively under construction.36 Total United States export capacity is projected to surge from roughly 14.3 billion cubic feet per day in 2025 to 23.5 billion cubic feet per day by 2030.38
  • Canada: Canada’s first major export terminal, LNG Canada in British Columbia, shipped its first cargo in late June 2025 and is slated to reach its full 1.84 billion cubic feet per day capacity in 2026.37 This West Coast location is highly strategic, as it reduces shipping times to Asian markets by 50 percent compared to United States Gulf Coast terminals.37 Additional projects like Woodfibre and Cedar will add further capacity by 2027 and 2028 respectively.37
  • Mexico: Developers are constructing two export projects in Mexico with a combined capacity of 0.6 billion cubic feet per day, including the Fast LNG Altamira floating production vessel off the east coast and Energia Costa Azul on the west coast.37
Export Facility ProjectLocationExport CapacityProjected Full Operational Timeline
Corpus Christi Stage 3 (Trains 8 & 9)Texas, United StatesUp to 4.45 billion cubic feet per day totalPhased ramp up through 2026
LNG Canada (Phase 1)British Columbia, Canada1.84 billion cubic feet per dayReaching full capacity in 2026
Golden PassTexas, United States2.1 billion cubic feet per dayFirst train expected mid-2026
Plaquemines (Phase 2)Louisiana, United States2.7 billion cubic feet per day (growing)Ramp up through 2026 into 2027
WoodfibreBritish Columbia, Canada0.3 billion cubic feet per dayExpected start in 2027
Cedar (Floating)British Columbia, Canada0.4 billion cubic feet per dayExpected start in 2028

While North America is constructing the capacity to replace Qatari gas, the timeframe is staggered. Terminals currently undergoing commissioning require three to six months to ramp up to full commercial operation.39 Therefore, Europe and Asia will face intense competition and severe price premiums for spot cargoes throughout 2026 until the North American capacity fully materializes and normalizes the market imbalance.

3.3. Methanol and Petrochemical Feedstocks

Methanol is a critical chemical building block globally. It is primarily utilized in the methanol to olefin process and in the synthesis of formaldehyde, which is essential for resins, plastics, adhesives, and construction materials.40 The Middle East is a dominant force in this sector, utilizing abundant low cost natural gas feedstocks to dominate the regional market.41 Saudi Arabia is the largest regional producer, while Iran is a massive exporter, shipping approximately 9 million tonnes annually, predominantly to China.41

The effective shut in of the Strait of Hormuz has stranded an estimated 18 to 20 million tonnes per year of Middle Eastern methanol supply.42 In a globally traded market of roughly 55 million tonnes, this represents a catastrophic supply shock.42 Consequently, methanol futures in China have spiked significantly, and regional prices in the Middle East jumped by 7 percent in a single week during the early stages of the conflict.12

Alternative Capacity and Activation Timeframes

The immediate loss of Middle Eastern methanol exports forces global buyers to look toward established producers in the Americas and emerging green technology sectors in Asia and Europe.

  • The Americas and Oceania: Global producers like Methanex operate distributed networks with facilities in the United States, Canada, Trinidad, Chile, and New Zealand.42 These facilities boast a combined capacity of over 10.4 million tonnes per year and produced 7.8 million tonnes in 2025.42 While these plants are currently operating, they will prioritize existing contract customers and lack the immediate spare capacity to fully replace 20 million tonnes of stranded Middle Eastern product overnight.42 North America has been closing the gap between domestic supply and demand over the past decade due to cheap domestic shale gas, making it a more self sufficient market, but limited in its ability to rescue Asia.43
  • Green and Bio-Methanol Production: Over the medium to long term, the market is shifting toward bio-methanol and e-methanol to lower carbon emissions. The European Union’s Net Zero Industry Act and Renewable Energy Directive are accelerating adoption through funding and policy support.44 By 2030, Singapore aims to produce over 1 million metric tons of low carbon methanol.44 Furthermore, China is rapidly retrofitting infrastructure in provinces like Shanxi, targeting massive upgrades to methanol fuel stations by 2025.44

In the immediate 2026 timeframe, the methanol market will suffer severe rationing. Downstream manufacturers in Asia will be forced to draw down inventories rapidly. The high cost of alternative natural gas feedstocks globally will keep replacement methanol prices elevated until Middle Eastern shipping resumes, squeezing margins for manufacturers of plastics, paints, and automotive parts worldwide.

3.4. Urea and Nitrogen Based Fertilizers

The global agricultural sector is highly exposed to the Gulf conflict, creating severe food security risks. The Middle East accounts for approximately 35 percent of the global seaborne trade in urea, exporting roughly 18 to 20 million tonnes annually.22 Industrially, urea is produced through the reaction of ammonia and carbon dioxide under high pressure, heavily relying on natural gas availability.47 The disruption of natural gas supplies and the physical blockade of vessels have effectively choked off supply from major exporters like Saudi Arabia and Qatar.45

Within 48 hours of the initial military strikes, North African urea prices surged by nearly 20 percent.48 Southeast Asian spot prices spiked to $700 per tonne, and United States Gulf futures jumped to $500 per tonne on the commodities exchange.46 This price shock comes at a highly sensitive time, as the Northern Hemisphere enters its critical spring planting season.

Alternative Capacity and Activation Timeframes

The immediate burden of replacing Middle Eastern urea shifts to producers in Southeast Asia and North America, though the transition is fraught with logistical and pricing challenges.

  • Southeast Asia and Oceania: Countries heavily reliant on Middle Eastern urea, such as Australia and Thailand, are pivoting rapidly to regional neighbors. Australia imports approximately 64 percent of its urea from the Middle East, while Thailand relies heavily on Saudi Arabia.22 Producers in Malaysia, Brunei, and Vietnam are stepping in to fill the void. For example, Vietnam’s Ca Mau facility successfully diverted 40,000 tonnes of granular urea to Australia for April 2026 loading to support the impending fertilizer application season.46
  • North America: United States farmers entered the 2026 spring planting season with roughly 75 percent of their required fertilizer supplies already secured locally.49 However, because fertilizers are globally priced commodities, United States domestic prices will still rise in sympathy with global shortages, adding to the record high input costs for American agriculture.49
  • China: While China is a massive urea producer, a persistent global price premium could lead the Chinese government to delay exports to protect domestic agricultural stability, further tightening the global market.48

The capacity to pick up urea demand exists in Asia and the Americas, and transactions are occurring within a rapid timeframe via the spot market. However, the sheer volume of displaced Middle Eastern urea means alternative suppliers can only partially mitigate the shortfall. This will lead to sustained high input costs for global farmers throughout the 2026 growing seasons, potentially forcing crop switching and lowering overall yields.22

3.5. Sulphur and Phosphate Fertilizer Complexes

Sulphur is a vital raw material required for the production of phosphate fertilizers, specifically monoammonium phosphate and diammonium phosphate. The Mideast Gulf exercises profound dominance over this market, originating fully 50 percent of the global seaborne sulphur trade, which totals approximately 20 million tonnes annually.22 The region also directly accounts for 20 percent of global monoammonium phosphate and 14 percent of global diammonium phosphate exports, primarily loaded from Saudi Arabia’s Ras al-Khair port.22

The blockade has triggered immediate price shocks, with United States Gulf diammonium phosphate prices climbing to $655 per metric ton in the first week of the war.22 The disruption severely threatens fertilizer producers in India and Morocco, which rely heavily on Middle Eastern sulphur and ammonia to manufacture finished phosphates for the global export market.22

Alternative Capacity and Activation Timeframes

Replacing 50 percent of the world’s sulphur is structurally challenging, and the timeframe for securing alternatives is heavily constrained by industrial realities.

  • Global Industrial Alternatives: Alternative sourcing must rely on by product sulphur captured from oil and gas refining operations in North America, China, and Russia. However, redirecting these flows involves complex logistical realignments and cannot be accomplished overnight. The lack of idle global sulphur capacity means the supply shock will be immediate and severe.
  • Agricultural Adaptation and Crop Switching: The primary alternative in this sector is demand destruction and agricultural adaptation. If the conflict restricts supplies beyond a few weeks, farmers in the Southern Hemisphere and South Asia will alter planting decisions. Producers will likely shift away from input intensive crops like maize, wheat, and rice in favor of oilseeds such as soybeans, which require significantly less applied nitrogen and phosphate.22
  • Regional Food Security Corridors: For the Persian Gulf countries themselves, which are highly dependent on agricultural imports through the Strait of Hormuz, alternative overland routes are being established. Grain shipments are moving from Russia to Iran and from Turkey to Iraq, but these overland routes incur significantly higher costs compared to maritime bulk shipping.22
Fertilizer ComponentMiddle East Global Export SharePrimary Affected ImportersMarket Mitigation Strategy
Sulphur50 percentChina, Morocco, India, AfricaSourcing by product sulphur from global refining operations
Urea35 percentBrazil, India, Thailand, AustraliaSoutheast Asian spot market purchases (Vietnam, Malaysia)
Ammonia21 percentIndia, Morocco, South KoreaGlobal inventory drawdowns and delayed production
Diammonium Phosphate14 percentIndia (primarily Q3 demand)Reduced application rates and crop switching to oilseeds

The shock to the phosphate supply chain will manifest as lower global crop yields and heightened food insecurity in vulnerable import dependent nations.22 Energy costs associated with post farmgate expenses, such as milling and refrigeration, will further exacerbate global food inflation.22

3.6. Primary Aluminum Smelting and Manufacturing

Aluminum smelting is incredibly energy intensive, making the energy rich Middle East a key global producer. The region accounts for 8 to 9 percent of global primary aluminum production and serves as a vital swing supplier to Europe, the United States, and non China Asian markets.17 The war has devastated this sector in the short term. Following the cessation of liquefied natural gas supplies from QatarEnergy, the Qatalum smelter was forced into a controlled shutdown.17 Simultaneously, Aluminium Bahrain declared force majeure due to the inability to export finished metal or import raw alumina through the heavily contested Strait of Hormuz.17

This immediate collapse in supply sent London Metal Exchange aluminum prices surging to near four year highs of $3,499.50 per ton.51 United States consumers are exceptionally vulnerable to this shock. The Middle East previously supplied nearly a fifth of United States aluminum imports, and domestic buyers are already squeezed by historical import tariffs.19

Alternative Capacity and Activation Timeframes

The aluminum supply chain operates on strict just in time delivery models, meaning supply disruptions cause immediate factory chaos for automotive, appliance, and construction manufacturers.19

  • Asia and Australia Sourcing: United States buyers and manufacturers, such as Bonnell Aluminum and RM Metals, are urgently scrambling to secure alternative cargoes from markets in India and Australia.19 Procurement teams are forced to operate on accelerated timelines of days to secure metal before inventory runs dry.19
  • North American Domestic Market: Manufacturers may tap the domestic United States or Canadian markets for near term deliveries, provided there is uncontracted spot metal available outside of annual agreements.19 Canada remains the largest foreign supplier to the United States and serves as a critical buffer.19
  • Structural Timelines: The search for alternative supplies is occurring rapidly. However, because new aluminum smelting capacity takes years to build and requires massive energy infrastructure, the global market will remain in a severe deficit until Middle Eastern logistics normalize.52 Furthermore, rising global energy costs threaten to inflate production costs for smelters worldwide, compounding the pricing pressure and leading to potential demand destruction over the medium term.51

3.7. Iron Ore Pellets and Direct Reduced Iron Steel

The conflict has disrupted raw material flows vital to modern steelmaking across the Gulf. Iran and Bahrain collectively accounted for roughly 18 percent of global seaborne iron ore pellet exports in 2025.18 These pellets are specifically graded for use in direct reduced iron facilities. The outbreak of hostilities abruptly halted bulk carriers from entering the Gulf to supply these plants, with shipping data indicating zero bulk carriers loaded with iron ore entering the Gulf in early March.18 Several vessels bound for Gulf ports diverted away from the region, risking a collapse in regional steel production and weighing heavily on local construction activity.18

Alternative Capacity and Activation Timeframes

The global iron ore pellet supply base is geographically diverse, allowing for a somewhat structured realignment of trade flows, though quality specifications remain a critical constraint.

  • South America: Brazil remains a dominant force in high grade pellet exports, with major producers like Vale and Samarco holding significant capacity.53 Although Vale slightly adjusted its 2026 output guidance, Brazilian export volumes remain robust and capable of absorbing diverted global demand.54
  • Asia: India is actively expanding its footprint in the seaborne market. State owned NMDC Limited has initiated long term pellet sales from its Donimalai plant, and Indian export capacities are well positioned to serve Asian buyers pivoting away from Middle Eastern suppliers.55 China, India, and South Korea are expected to showcase promising growth in pellet sales.55
  • Eastern Europe: Despite regional conflicts, Ukraine’s Metinvest has demonstrated remarkable production resilience, allocating massive investments to scale pellet production and launching 11 new product types.55
  • Market Realignment Timeline: Iron ore trade flows will shift over the course of the 2026 fiscal quarters. Shippers are currently restructuring short term cargo offers to account for higher freight and insurance costs.56 Market participants anticipate that the convergence of Brazilian capacity scaling and Indian procurement expansion will stabilize the high grade pellet market by late 2026.55 Chinese mills, facing sluggish domestic property sector demand, are maintaining cautious inventory light models and prioritizing cost effective procurement channels.54

3.8. Air Freight Cargo Capacity and Global Logistics

The airspace restrictions and safety risks resulting from the intense missile exchanges have severely crippled the Middle East’s role as a global aviation transit hub. Key consolidation points, specifically Dubai, Abu Dhabi, and Doha, have seen operations vastly degraded with over 3,400 flights cancelled or diverted.20 In 2024, Dubai and Doha processed 2.2 million and 2.6 million tonnes of freight respectively, representing roughly two thirds of all Middle Eastern air cargo.58

The sudden restriction of these critical hubs removed an estimated 12 percent of global cargo capacity from the market overnight.59 This capacity shock occurred against a backdrop of already rising global demand, pushing dynamic load factors higher and driving air cargo spot rates up by 5 percent globally.59 Specific corridors felt the shock more acutely, with Europe to North America rates seeing 21 percent spikes, and the Northeast Asia to North America semiconductor corridor seeing rates grow by 10 percent.59

Alternative Capacity and Activation Timeframes

The logistics industry is highly agile, but rerouting global trade around a major continental hub incurs severe time and cost penalties.

  • Alternative Flight Routing: Carriers are forced to divert flights, adding intermediate stops and avoiding the airspace entirely.60 Freight forwarders are shifting volumes to the Transpacific corridor and utilizing direct Asia to Europe routes that bypass the Gulf entirely.57
  • Intermodal Solutions: Shippers are increasingly relying on sea air combinations via alternative regional ports, though these multimodal solutions add significant transit time and complexity.
  • Duration of Impact: The capacity crunch is immediate and will persist for the exact duration of the military conflict and airspace closures.20 The logistics market’s recovery is entirely dependent on the cessation of hostilities. Furthermore, rising jet fuel costs, which are directly tied to the crude oil price spikes caused by the Strait of Hormuz blockade, will further inflate air freight rates in the short to medium term, acting as a major cost component for all diverted flights.20

3.9. Water Desalination and Regional Security Infrastructure

Unlike globally traded commodities, the disruption to water desalination infrastructure presents an existential and strictly localized crisis for the Persian Gulf. The Gulf states, often referred to as saltwater kingdoms, rely on more than 400 desalination plants to provide drinking water for approximately 100 million people.61 In nations like Kuwait, Oman, and Saudi Arabia, energy intensive desalination accounts for 70 to 90 percent of the municipal water supply.62

Iran has explicitly targeted this critical infrastructure. Drone strikes have caused material damage to a water desalination plant in Bahrain, marking the first time a Gulf nation reported targeting of such a facility during the conflict.63 Additionally, Iranian projectiles have landed dangerously close to Dubai’s massive Jebel Ali complex, which produces over 160 billion gallons of water a year.61 Furthermore, because many desalination plants are physically integrated with local power grids via combined heat and power systems, attacks on general energy infrastructure pose severe cascading risks to water production.64

Alternative Capacity and Activation Timeframes

The water security crisis in the Gulf is unique because it cannot be solved through international trade or global supply chain realignment.

  • Lack of Viable Alternatives: There are no external regions that can supply municipal water to the Middle East at the required scale. Alternatives such as mobile desalination units or imported bottled water tankers are logistically incapable of sustaining populations of millions.61
  • Timeframe to Crisis: The timeframe for this shock is measured in days, not months. Defense analysts warn that if major plants are knocked offline, entire cities could deplete their drinking water reserves within 48 to 72 hours.65
  • Security Mobilization: To mitigate this existential threat, regional governments are urgently attempting to hire private foreign military specialists, radar operators, and electronic warfare technicians to bolster the layered defense of these facilities.15 Private military corporations are seeing increased demand for ground security teams and system specialists to provide protection during active operations.15

3.10. Defense Industrial Base and Munitions Manufacturing

The unprecedented intensity of Operation Epic Fury has placed massive strain on the United States defense industrial base. The air campaign requires an extraordinary expenditure of precision guided munitions and interceptors to systematically dismantle Iranian ballistic capabilities and defend regional assets.8 The operation is estimated to cost nearly $900 million per day, driven heavily by munition consumption.68 Key assets being depleted rapidly include Joint Direct Attack Munitions, Tomahawk cruise missiles, AIM-9X air to air missiles, and Patriot PAC-3 MSE interceptors.66

The United States military was already firing interceptors in the Red Sea at rates faster than they could be manufactured prior to the Iran conflict.70 The current war has exposed structural bottlenecks in the American defense supply chain that cannot be resolved quickly by merely increasing budget allocations or utilizing the Defense Production Act.

Alternative Capacity and Activation Timeframes

The capacity to pick up this manufacturing demand relies entirely on domestic and allied defense contractors, but the supply chain is highly constrained by industrial physics.

  • Industrial Bottlenecks and Specialty Chemistry: Final assembly of missiles is rarely the binding constraint. The production of solid rocket motors is limited by a narrow slice of specialty chemistry.70 Specifically, the supply of ammonium perchlorate, a critical oxidizer, is consolidated into very few vulnerable domestic production nodes.70 Curing times for rocket propellants and strict qualification regimes for energetic materials cannot be safely rushed.70
  • Rare Earth Mineral Dependence: Advanced missiles require rare earth minerals like neodymium and samarium for guidance systems, and tungsten for kinetic penetrators.70 The processing of these critical minerals is heavily dominated by China, creating a severe strategic vulnerability for the United States defense supply chain.70
  • Production Surges and Investment: The defense sector, led by primes like Lockheed Martin, RTX, and L3Harris, is attempting to surge output, treating the conflict as a primary growth engine.71 The Pentagon has executed massive direct investments into rocket motor businesses to secure propulsion supplies.70
  • Activation Timeframe: Replenishment timelines are measured in years, not months. For context, prior to the surge, Patriot PAC-3 MSE missiles were produced at a rate of only 600 to 650 annually.69 The defense industrial base will require a multi year mobilization stretching through 2027 and 2030 to replace the massive inventories expended in the 2026 conflict.70
Critical munition replenishment bottlenecks: ammonium perchlorate, neodymium, tungsten. Years timeframe.

4. Geopolitical Responses and Regional Defense Postures

The 2026 Iranian Gulf War has catalyzed a profound shift in regional defense postures and diplomatic alignments. Foreign affairs analysts note that the scale of the Iranian retaliation forced an unprecedented all of government response across the Gulf Cooperation Council.72 For the first time in history, all Gulf Cooperation Council states were targeted by the same actor within a 24 hour period, realizing a long standing strategic nightmare for regional planners.72

The performance of regional integrated air and missile defense networks has been a critical variable in mitigating the conflict’s economic fallout. A years long effort to boost United States and Gulf security cooperation has yielded positive tactical results. The United Arab Emirates reported intercepting 175 of 189 detected ballistic missiles and 876 of 941 detected drones, representing interception rates exceeding 92 percent.13 Qatar similarly reported intercepting 98 of 101 ballistic missiles, and Bahrain successfully destroyed dozens of incoming projectiles.14

However, the national security analysis reveals a critical vulnerability regarding sustainability. While the interception rates are high, the cost asymmetry heavily favors Iran. Iran relies on comparatively cheap drones and legacy ballistic missiles, whereas the Gulf states expend highly sophisticated, multi million dollar interceptors.13 Gulf nations, including the United Arab Emirates and Qatar, have already urgently requested the United States to help replenish their dwindling interceptor stockpiles.13

Diplomatically, the conflict is accelerating the fragmentation of the global order. Russia faces a strategic dilemma regarding its partnership with Iran. While Russia is not operationally dependent on Iran for its war in Ukraine, Moscow is actively sharing intelligence to support Iranian strikes against United States forces, seeking to tie down American military resources in the Middle East.8 Conversely, China finds itself trapped by the closure of the Strait of Hormuz, a waterway through which 45 percent of its imported oil and gas passes.9 Beijing is reportedly highly displeased with Tehran’s blockade and is actively engaging in direct negotiations with Iranian officials to secure safe passage exemptions for Chinese flagged tankers.9 However, maritime tracking data indicates that despite these diplomatic efforts, Chinese vessels remain largely frozen in the Gulf alongside Western shipping, exposing the limits of Beijing’s leverage over Tehran during an active survival crisis.7

5. Strategic Conclusions and Long Term Outlook

The 2026 Iranian Gulf War has demonstrated with absolute clarity that the global economy remains dangerously exposed to single point logistical failures. While the immediate focus of Operation Epic Fury has been the kinetic degradation of Iranian military and proxy capabilities, the second order effects have triggered a systemic reorganization of global supply chains.

The aggregated economic and energy sector data indicates that while energy markets have robust structural plans to increase capacity in the Americas, these additions are staggered over years. They cannot instantly replace the 20 million barrels of oil and massive volumes of gas trapped behind the Strait of Hormuz. Consequently, the global economy faces unavoidable short term inflationary pressures and heightened volatility in energy pricing through the remainder of 2026.

More critically, the conflict has highlighted severe vulnerabilities in less visible, yet equally vital, supply chains. The Middle East’s outsized role in the export of agricultural inputs poses a direct threat to global food security. A prolonged blockade will force structural changes in global agriculture, heavily impacting crop yields in import dependent regions across the Global South. Simultaneously, the rapid depletion of precision guided munitions has exposed the fragility of the United States defense industrial base, revealing deep dependencies on fragile chemical supply chains and foreign processed rare earth elements.

Ultimately, the geoeconomic legacy of this conflict will be a forced acceleration away from optimized, single source globalism. Governments and multinational corporations are now heavily incentivized to prioritize redundancy, invest massively in alternative geographic hubs across the Americas and Asia, and subsidize domestic manufacturing for critical materials, regardless of the immediate financial costs. The era of assuming uninterrupted access to the Persian Gulf has decisively ended.


Please share the link on Facebook, Forums, with colleagues, etc. Your support is much appreciated and if you have any feedback, please email us in**@*********ps.com. If you’d like to request a report or order a reprint, please click here for the corresponding page to open in new tab.


Works cited

  1. 2026 Iran conflict | Explained, United States, Israel, Map, & War | Britannica, accessed March 9, 2026, https://www.britannica.com/event/2026-Iran-Conflict
  2. Peace Through Strength: President Trump Launches Operation Epic Fury to Crush Iranian Regime, End Nuclear Threat – The White House, accessed March 9, 2026, https://www.whitehouse.gov/articles/2026/03/peace-through-strength-president-trump-launches-operation-epic-fury-to-crush-iranian-regime-end-nuclear-threat/
  3. Middle East Special Issue: March 2026, accessed March 9, 2026, https://acleddata.com/update/middle-east-special-issue-march-2026
  4. How Gulf States are responding to Iran’s retaliatory strikes, accessed March 9, 2026, https://www.washingtonexaminer.com/news/world/4476568/gulf-states-qatar-saudi-arabia-kuwait-bahrain-uae-responding-iran-retaliatory-strikes/
  5. Iran has largely halted oil and gas exports through strait of Hormuz – The Guardian, accessed March 9, 2026, https://www.theguardian.com/world/2026/mar/03/iran-has-largely-halted-oil-and-gas-exports-through-strait-of-hormuz
  6. March 8, 2026: Iran War Maritime Intelligence Daily – Windward, accessed March 9, 2026, https://windward.ai/blog/march-8-maritime-intelligence-daily/
  7. No One, Not Even Beijing, Is Getting Through the Strait of Hormuz, accessed March 9, 2026, https://www.csis.org/analysis/no-one-not-even-beijing-getting-through-strait-hormuz
  8. Iran Update Evening Special Report, March 6, 2026, accessed March 9, 2026, https://understandingwar.org/research/middle-east/iran-update-evening-special-report-march-6-2026/
  9. China Seeks Iran Deal for Tanker Passage Through Closed Strait of Hormuz, accessed March 9, 2026, https://chinaglobalsouth.com/2026/03/09/china-iran-strait-of-hormuz-oil-shipments/
  10. 2026 Iran war – Wikipedia, accessed March 9, 2026, https://en.wikipedia.org/wiki/2026_Iran_war
  11. The Energy Shock: U.S.-Israel War with Iran’s Impact on Indian …, accessed March 9, 2026, https://newlinesinstitute.org/middle-east-center/the-energy-shock-u-s-israel-war-with-irans-impact-on-indian-chinese-and-global-economies/
  12. ChemAnalyst Digest: How Iran War Affects Chemical Prices Globally, Should You be Worried?, accessed March 9, 2026, https://www.chemanalyst.com/NewsAndDeals/NewsDetails/chemanalyst-digest-how-iran-war-affects-chemical-prices-41348
  13. War Comes to the Gulf | The Washington Institute, accessed March 9, 2026, https://www.washingtoninstitute.org/policy-analysis/war-comes-gulf
  14. Iran’s drone and missile attacks on Gulf countries in numbers, accessed March 9, 2026, https://english.alarabiya.net/News/gulf/2026/03/04/iran-s-drone-and-missile-attacks-on-gulf-countries-in-numbers-
  15. Gulf states turn to private foreign military specialists amid Iran attacks, accessed March 9, 2026, https://www.middleeasteye.net/news/gulf-states-turn-private-foreign-military-specialists-amid-iran-attacks
  16. Commercial and Supply Chain Implications of the Gulf Conflict …, accessed March 9, 2026, https://www.gibsondunn.com/commercial-and-supply-chain-implications-of-the-gulf-conflict-shipping-contracts-and-insurance/
  17. The Middle East conflict and its impact on global metals markets, accessed March 9, 2026, https://www.argusmedia.com/en/news-and-insights/market-opinion-and-analysis-blog/middle-east-conflict-impact-global-metals-markets
  18. Middle East war disrupts dry bulk commodity trade as Hormuz shipping grinds to a halt, accessed March 9, 2026, https://www.kpler.com/blog/middle-east-war-disrupts-dry-bulk-commodity-trade-as-hormuz-shipping-grinds-to-a-halt
  19. US aluminium buyers hunt for alternatives as Iran war upends global supply, accessed March 9, 2026, https://www.businesstimes.com.sg/companies-markets/energy-commodities/us-aluminium-buyers-hunt-alternatives-iran-war-upends-global-supply
  20. Iran conflict tests 2026 air cargo outlook – Supply Chain Dive, accessed March 9, 2026, https://www.supplychaindive.com/news/middle-east-conflict-tests-2026-air-cargo-outlook/814069/
  21. 2026 Strait of Hormuz crisis – Wikipedia, accessed March 9, 2026, https://en.wikipedia.org/wiki/2026_Strait_of_Hormuz_crisis
  22. The Iran war: Potential food security impacts | IFPRI, accessed March 9, 2026, https://www.ifpri.org/blog/the-iran-war-potential-food-security-impacts/
  23. 2026 Outlook Energy Sector – Gabelli, accessed March 9, 2026, https://gabelli.com/research/2026-outlook-energy-sector/
  24. Petroleum liquids supply growth driven by non-OPEC+ countries in 2025 and 2026 – U.S. Energy Information Administration (EIA), accessed March 9, 2026, https://www.eia.gov/todayinenergy/detail.php?id=64565
  25. EIA forecasts U.S. crude oil production will decrease slightly in 2026 – U.S. Energy Information Administration (EIA), accessed March 9, 2026, https://www.eia.gov/todayinenergy/detail.php?id=66844
  26. United States Crude Oil Production – Trading Economics, accessed March 9, 2026, https://tradingeconomics.com/united-states/crude-oil-production
  27. Canadian Production Set for 3.5% Increase in 2026: Possible Pipeline Constraints Loom – A Plainview on Crude Oil, accessed March 9, 2026, https://www.plainview-energy.com/p/plainview-weekly-canadian-production
  28. Brazil, Guyana, and Argentina support forecast crude oil growth in 2026 – U.S. Energy Information Administration (EIA), accessed March 9, 2026, https://www.eia.gov/todayinenergy/detail.php?id=66884
  29. Venezuelan Oil Supply Crisis: Market Implications for 2026 – Fubex Lubricants, accessed March 9, 2026, https://fubex.net/blog/venezuelan-oil-supply-crisis-market-implications-for-2026/
  30. Breaking Down Venezuela’s Oil Outlook for the future – Aurora Energy Research, accessed March 9, 2026, https://auroraer.com/resources/aurora-insights/articles/breaking-down-venezuelas-oil-outlook-for-the-future
  31. EIA sees 2026 oil production decline despite regional growth, accessed March 9, 2026, https://energy-oil-gas.com/news/eia-sees-2026-oil-production-decline-despite-regional-growth/
  32. Gains, Risks and Regional Implications of US’ Iran War, accessed March 9, 2026, https://impakter.com/gains-risks-and-regional-implications-of-us-iran-war/
  33. U.S. LNG developers sign highest volume of sale and purchase contracts since 2022, accessed March 9, 2026, https://www.eia.gov/todayinenergy/detail.php?id=67264
  34. Energy Department Approves Export Expansion at Corpus Christi LNG, accessed March 9, 2026, https://www.energy.gov/articles/energy-department-approves-export-expansion-corpus-christi-lng
  35. Corpus Christi becomes second-largest US LNG export project thanks to export expansion approval, accessed March 9, 2026, https://www.offshore-energy.biz/corpus-christi-becomes-second-largest-us-lng-export-project-thanks-to-export-expansion-approval/
  36. Global LNG Capacity Tracker – Data Tools – IEA, accessed March 9, 2026, https://www.iea.org/data-and-statistics/data-tools/global-lng-capacity-tracker
  37. North America’s LNG export capacity could more than double by 2029 – U.S. Energy Information Administration (EIA), accessed March 9, 2026, https://www.eia.gov/todayinenergy/detail.php?id=66384
  38. US LNG Capacity Forecast to 2030 – Incorrys, accessed March 9, 2026, https://incorrys.com/liquefied-natural-gas-lng-forecast/north-american-lng-exports-to-2030/
  39. Iran Conflict Sets the LNG Markets on End: What Does This Mean for the Market, Investors, and Consumers?, accessed March 9, 2026, https://energynewsbeat.co/iran-conflict-sets-the-lng-markets-on-end-what-does-this-mean-for-the-market-investors-and-consumers/
  40. Innovation Outlook: Renewable Methanol, accessed March 9, 2026, https://methanol.org/wp-content/uploads/2020/04/IRENA_Innovation_Renewable_Methanol_2021.pdf
  41. Middle East Methanol Market Size | Industry Report, 2033, accessed March 9, 2026, https://www.grandviewresearch.com/industry-analysis/middle-east-methanol-market-report
  42. Methanex sees 18-20 million tonnes/year of Middle East methanol exports shut in – CEO, accessed March 9, 2026, https://www.icis.com/explore/resources/news/2026/03/06/11186452/methanex-sees-18-20-million-tonnes-year-of-middle-east-methanol-exports-shut-in-ceo
  43. Scaling Up Hydrogen: The Case for Low- Carbon Methanol – Bloomberg Professional Services, accessed March 9, 2026, https://assets.bbhub.io/media/sites/25/2024/06/BNEF-Methanol-Report_to-publish.pdf
  44. Green Methanol Market Growth, Forecast, and Industry Insights Report, accessed March 9, 2026, https://www.skyquestt.com/report/green-methanol-market
  45. Offers for urea derivatives evaporate, accessed March 9, 2026, https://www.argusmedia.com/news-and-insights/latest-market-news/2798316-offers-for-urea-derivatives-evaporate
  46. Urea derivatives surge on Middle East conflict | Latest Market News – Argus Media, accessed March 9, 2026, https://www.argusmedia.com/en/news-and-insights/latest-market-news/2794835-urea-derivatives-surge-on-middle-east-conflict
  47. Urea Market Size, Share & Growth Analysis | Report [2034] – Fortune Business Insights, accessed March 9, 2026, https://www.fortunebusinessinsights.com/urea-market-106850
  48. Global fertilizer markets feel impact of conflict in the Middle East – Rabobank, accessed March 9, 2026, https://www.rabobank.com/knowledge/q011517071-global-fertilizer-markets-feel-impact-of-conflict-in-the-middle-east
  49. Middle East Tensions Raise Spring Planting Concerns, accessed March 9, 2026, https://www.fb.org/market-intel/middle-east-tensions-raise-spring-planting-concerns
  50. Iran war to disrupt urea and sulphur supplies, accessed March 9, 2026, https://www.producer.com/crops/iran-war-to-disrupt-urea-and-sulphur-supplies/
  51. Aluminum Surges on Supply Fears Amidst Oil Shock, accessed March 9, 2026, https://www.whalesbook.com/news/English/commodities/Aluminum-Surges-on-Supply-Fears-Amidst-Oil-Shock/69ae37116431e3e2859c2784
  52. Conflict in the Middle East threatens aluminium and alumina trade flows – CRU Group, accessed March 9, 2026, https://www.crugroup.com/en/communities/thought-leadership/2026/Conflict-in-the-Middle-East-threatens-aluminium-and-alumina-trade-flows/
  53. Iron Ore Pellets Market Size, Share | Industry Report [2026-2034], accessed March 9, 2026, https://www.fortunebusinessinsights.com/iron-ore-pellets-market-113953
  54. A shift in iron ore trade flows, preferences across imported iron ore grades expected in 2026, accessed March 9, 2026, https://www.fastmarkets.com/insights/shift-iron-ore-trade-flows-across-imported-iron-ore-grades-expected/
  55. Iron Ore Pellets Market Size & Forecast 2026-2036 – Future Market Insights, accessed March 9, 2026, https://www.futuremarketinsights.com/reports/iron-ore-pellet-market
  56. Global iron ore exports soften in February 26 as Chinese buying slows – SteelOrbis, accessed March 9, 2026, https://www.steelorbis.com/steel-news/latest-news/global-iron-ore-exports-soften-in-february-26-as-chinese-buying-slows-1440147.htm
  57. Air Freight Market Update – DHL Global Forwarding – United States of America, accessed March 9, 2026, https://www.dhl.com/us-en/home/global-forwarding/latest-news-and-webinars/air-freight-market-update.html
  58. GCC Air Freight Transport Market – Size, Share & Industry Trends Analysis, accessed March 9, 2026, https://www.mordorintelligence.com/industry-reports/gcc-air-freight-transport-market
  59. Middle East conflict clouds air cargo outlook despite demand rise – STAT Times, accessed March 9, 2026, https://www.stattimes.com/air-cargo/middle-east-conflict-clouds-air-cargo-outlook-despite-demand-rise-1358298
  60. Global Outlook for Air Transport Trade, AI, and the energy transition – IATA, accessed March 9, 2026, https://www.iata.org/en/iata-repository/publications/economic-reports/global-outlook-for-air-transport-december-2025/
  61. Iran Threatens Gulf Water Lifeline, accessed March 9, 2026, https://impakter.com/iran-threatens-gulf-water-lifeline/
  62. Oil built the Persian Gulf. Desalinated water keeps it alive. War could threaten both – Florida Politics, accessed March 9, 2026, https://floridapolitics.com/archives/783951-oil-built-the-persian-gulf-desalinated-water-keeps-it-alive-war-could-threaten-both/
  63. How targeting of desalination plants could disrupt water supply in the Gulf – Al Jazeera, accessed March 9, 2026, https://www.aljazeera.com/amp/news/2026/3/8/how-targeting-of-desalination-plants-could-disrupt-water-supply-in-the-gulf
  64. US-Iran conflict targets desalination, fueling Middle East water crisis fears – CHOSUNBIZ, accessed March 9, 2026, https://biz.chosun.com/en/en-international/2026/03/09/ZGN5DVLHPVCTTEWWZNDNHYCNEE/
  65. Oil built the Persian Gulf. Desalinated water keeps it alive. War could threaten both, accessed March 9, 2026, https://apnews.com/article/iran-war-desalination-water-oil-middle-east-12b23f2fa26ed5c4a10f80c4077e61ce
  66. FPRI Experts React | Understanding the Third Gulf War, accessed March 9, 2026, https://www.fpri.org/article/2026/03/fpri-experts-react-understanding-the-third-gulf-war/
  67. Why Iran’s ballistic missile launches are declining, accessed March 9, 2026, https://www.fdd.org/analysis/2026/03/04/why-irans-ballistic-missile-launches-are-declining/
  68. Latest Analysis: War with Iran | CSIS, accessed March 9, 2026, https://www.csis.org/programs/latest-analysis-war-iran
  69. Trump rallies defense titans to surge weapons output as Iran War rages, accessed March 9, 2026, https://wfin.com/fox-political-news/trump-rallies-defense-titans-to-surge-weapons-output-as-iran-war-rages/
  70. How Chemistry and Rocket Motors Constrain American Warfighting …, accessed March 9, 2026, https://nationalinterest.org/blog/buzz/how-chemistry-and-rocket-motors-constrain-american-warfighting
  71. User, accessed March 9, 2026, http://markets.chroniclejournal.com/chroniclejournal/article/marketminute-2026-3-9-war-footing-us-defense-stocks-break-out-as-west-asia-conflict-reaches-fever-pitch
  72. ‘Nightmare scenario’ for GCC countries, region as Iran unloads drones and missiles, accessed March 9, 2026, https://breakingdefense.com/2026/03/iran-attacks-uae-saudi-missiles-drones-gcc-air-defense/
  73. The Iran war exposes the limits of Russia’s leverage in a …, accessed March 9, 2026, https://www.chathamhouse.org/2026/03/iran-war-exposes-limits-russias-leverage-fragmenting-regional-order