Tag Archives: Epic Fury

Strait of Hormuz Crisis: Navigating Maritime Blockades

The global geopolitical and macroeconomic architecture has been fundamentally destabilized by the outbreak of the 2026 Iran War and the subsequent, highly effective closure of the Strait of Hormuz. Following the initiation of Operation Epic Fury by the United States and Operation Roaring Lion by Israel on February 28, 2026, the Islamic Republic of Iran suffered catastrophic degradation of its conventional military capabilities.1 The allied strike campaign systematically dismantled Iranian air defenses, targeted strategic command nodes, and eliminated an estimated 92 percent of the Islamic Revolutionary Guard Corps Navy (IRGCN) large blue-water vessels.1 Furthermore, the campaign successfully executed decapitation strikes against top echelon leadership, including Supreme Leader Ali Khamenei, Supreme National Security Council official Ali Larijani, and IRGCN Commander Alireza Tangsiri.1

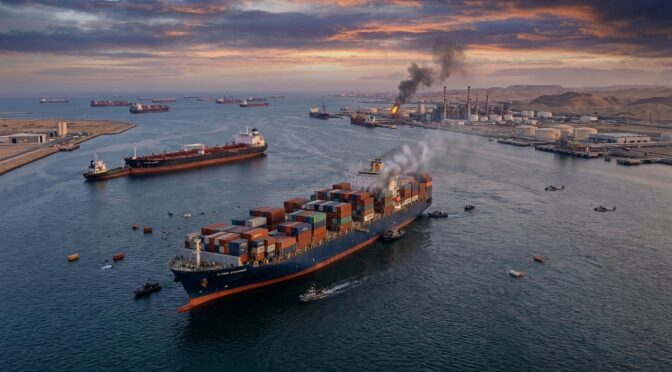
Despite this overwhelming application of conventional force—which included the delivery of over 12,000 precision munitions against more than 15,000 targets across the Iranian homeland—Iran has successfully executed an Anti-Access/Area-Denial (A2/AD) strategy that has paralyzed the world’s most critical energy transit corridor.3 The resulting disruption has triggered the largest oil supply shock in global history, effectively trapping thousands of commercial vessels, sending Brent crude prices to historic peaks, and triggering a cascading crisis in global agricultural supply chains.1

This report provides an exhaustive, multi-domain analysis of the strategic paradox defining the 2026 conflict: how a severely degraded state actor retains the capacity to blockade a vital maritime chokepoint against the world’s premier naval powers. It further examines the weaponization of commercial maritime insurance, the establishment of the extortionary “Tehran Toll Booth” transit regime, the expansion of the conflict into the Bab al-Mandab strait, and evaluates five strategic scenarios available to the United States and its allies to restore freedom of navigation, ranked from the most likely to be effective to the least.

The Paradox of Power: Operation Epic Fury and the Illusion of Conventional Supremacy

The foundational premise that the destruction of Iran’s conventional military apparatus equates to the reopening of the Strait of Hormuz represents a fundamental miscalculation of Iranian asymmetric naval doctrine. Operation Epic Fury was designed with laser-focused objectives: to destroy Iranian offensive missiles, neutralize missile production facilities, and annihilate the Iranian Navy.7 While U.S. Central Command (CENTCOM) forces, utilizing B-2 stealth bombers, B-1 Lancers, and Tomahawk land-attack cruise missiles, successfully neutralized major naval facilities at Bandar Abbas, Chabahar, and Konarak, this conventional destruction did not translate into sea control.1

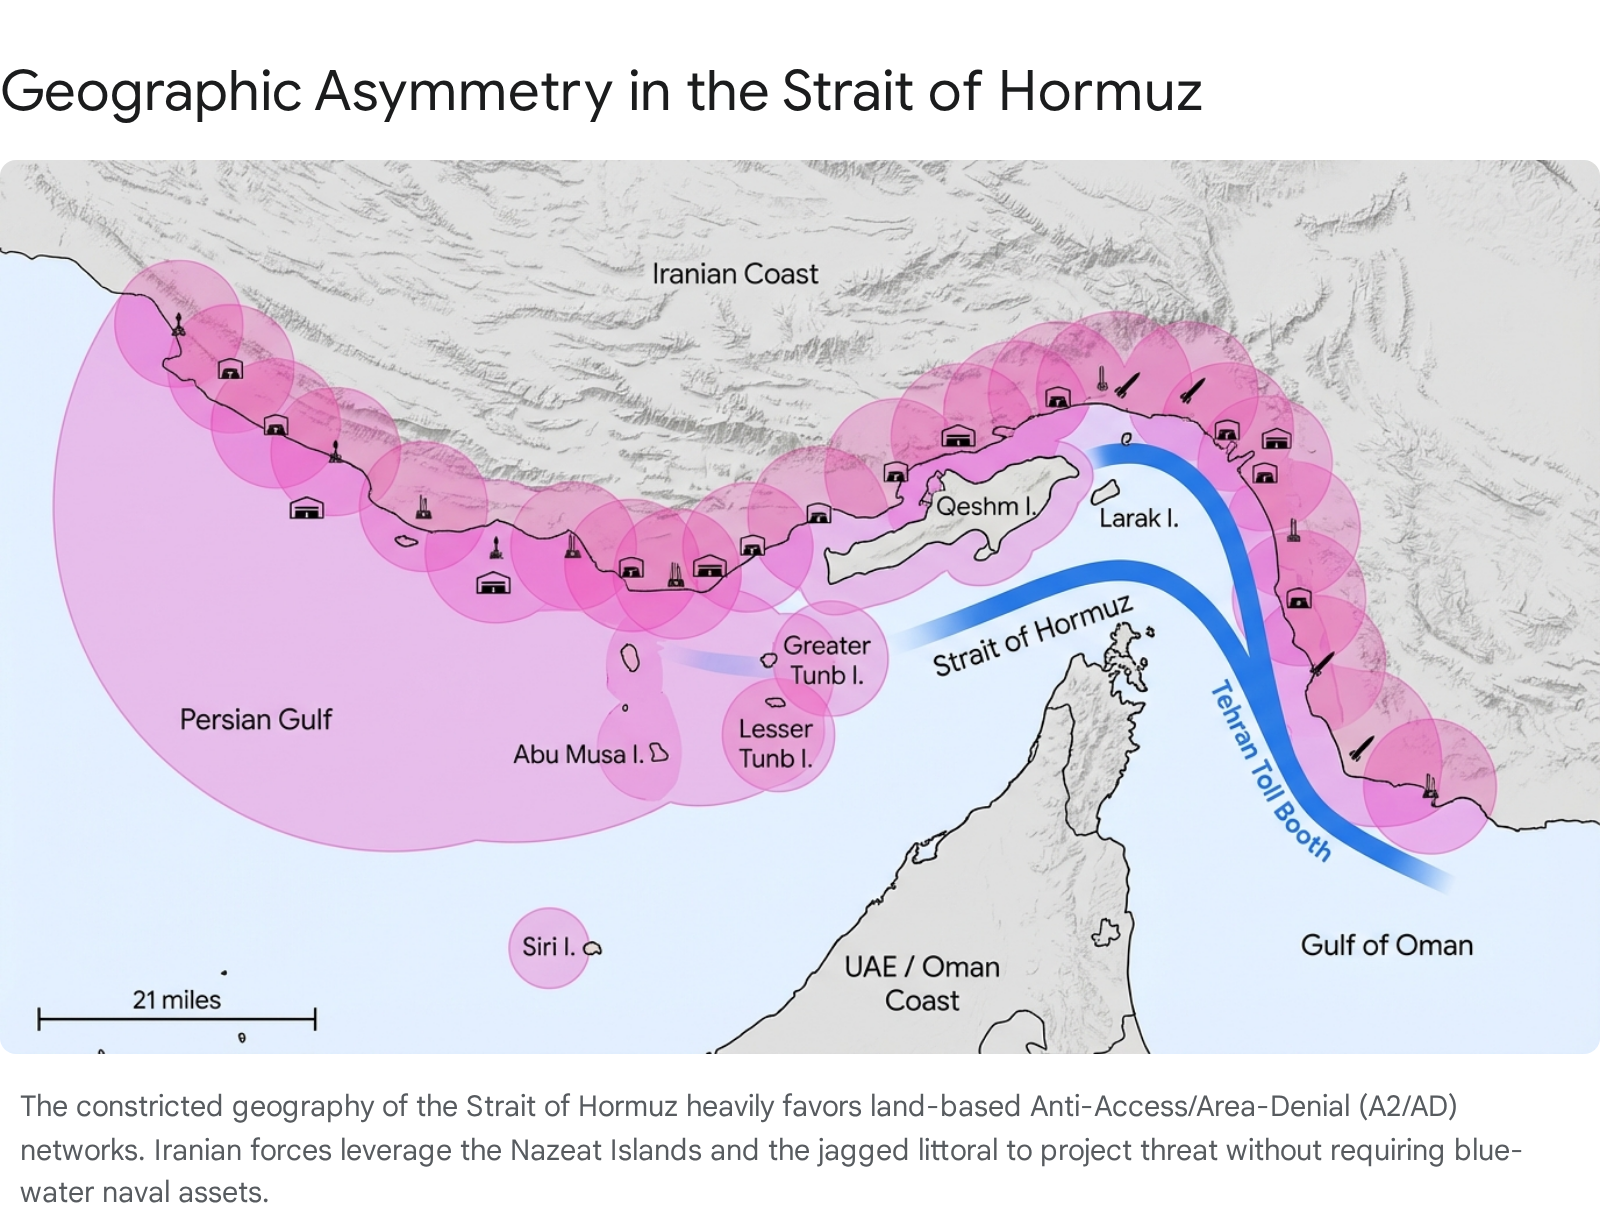
Iran’s ability to shut down the Strait of Hormuz indefinitely does not rest on capital ships, frigates, or symmetrical naval dominance. Instead, Tehran’s doctrine relies on a deliberate, decentralized, and highly survivable A2/AD posture.9 This strategy is explicitly designed to raise operational risks to commercial shipping to levels that civilian operators and marine insurance markets simply cannot tolerate, thereby forcing tanker rerouting and triggering global economic disruption.9

The United States Navy possesses unquestionable surface superiority, with a massive deployment of carrier strike groups, including the USS Abraham Lincoln and the USS Gerald R. Ford, operating in the region alongside an armada of AEGIS-equipped destroyers.10 However, established naval doctrine draws a sharp distinction between “sea denial”—the ability to destroy enemy vessels and prevent them from operating freely—and “sea control”—the ability to safeguard and guarantee continuous civilian transit through a highly contested zone.10 The U.S. military has successfully achieved total sea denial against the IRGCN’s conventional assets, but it remains structurally incapable of achieving sea control within the constricted, 21-mile-wide geography of the Strait of Hormuz.10

Iran’s ultimate strategic advantage in this theater relies on the ascendancy of “dumb mass” over “cutting-edge quality”.10 The IRGCN utilizes a low-cost, high-volume arsenal of coastal defense cruise missiles, unmanned aerial vehicles (UAVs), and fast-attack craft positioned along the jagged and mountainous Iranian littoral.9 Intercepting these asymmetric threats is economically and tactically unsustainable for advanced naval forces over a prolonged duration. The interceptor cells and anti-missile gun magazines aboard U.S. destroyers and allied frigates cost millions of dollars per engagement and deplete far more rapidly than Iran’s vast, dispersed stockpiles of expendable munitions.10 Consequently, the U.S. Navy can effectively win every tactical engagement against incoming Iranian fire while simultaneously losing the broader strategic campaign to keep the waterway open for unarmed merchant vessels.

The Architecture of Area Denial: Mines, Islands, and Electronic Warfare

The physical mechanisms by which Iran enforces this blockade are deeply integrated into the geography of the Persian Gulf and the Gulf of Oman. The Strait of Hormuz is not merely a broad expanse of water; commercial shipping is canalized by draft restrictions and navigational safety requirements into a highly predictable transit pattern.12 This predictability allows Iran to optimize its A2/AD assets.

Strait of Hormuz map showing Iranian A2/AD network, highlighting geographic asymmetry and potential maritime blockades.

The Nazeat Islands: Forward Operating Fortresses

Iran has systematically fortified the Nazeat Islands—a strategic chain comprising Greater Tunb, Lesser Tunb, Abu Musa, and Siri—transforming them into unsinkable forward operating bases that project threat directly over the international shipping lanes.13 These islands host vital communications infrastructure, fuel depots, maintenance facilities, and aircraft hangars.13

More critically, the islands conceal a vast network of hardened underground bunkers utilized to store and launch anti-ship cruise missiles.13 Greater Tunb and Abu Musa also feature port facilities capable of sheltering and deploying fast-attack craft.13 While CENTCOM forces have utilized 5,000-pound GBU-72 penetrator munitions to strike subterranean targets along the coast and on these islands, the sheer volume of dispersed, fortified sites ensures that a lethal baseline threat remains highly resilient to aerial bombardment.1

Naval Mining and the Weaponization of Tides

Further complicating the maritime security environment is Iran’s deployment of advanced naval mines. The U.S. military has successfully engaged Iranian minelaying capabilities, with CENTCOM reporting the destruction of 44 dedicated minelaying vessels.13 However, the strategic reality of the Strait dictates that Iran does not strictly require specialized ships to lay mines. The notoriously strong tidal currents of the Strait of Hormuz allow Iranian forces to covertly float mines into the transit lanes from various obscured points along their extensive shoreline.10

Intelligence assessments confirm that Iran has deployed the Maham 3 and Maham 7 series naval mines into the waterway.13 The Maham 3 is a moored, buoyant, high-explosive anti-shipping mine capable of being set at depths of up to 100 meters.13 It utilizes sophisticated magnetic and acoustic sensors capable of detecting a ship’s presence from approximately three meters in any direction.13 The Maham 7 is a lightweight “bottom influence” mine that rests on the seafloor, designed to target medium-sized ships, landing craft, and small submarines.13 It can be rapidly deployed by small surface vessels or dropped via parachute from helicopters.13

The strategic impact of these weapons is wildly disproportionate to their numbers. Intelligence suggests that Iran has deployed only a highly limited number of mines—estimated at between fewer than ten to a dozen active units.13 Yet, the mere confirmed presence of unexploded ordnance in a confined maritime terrain instantly alters the risk calculus. Because mine clearance operations are slow, technically demanding, and leave specialized minesweeping vessels highly vulnerable to follow-on drone or missile attacks, even a token deployment of mines can keep the world’s most critical oil chokepoint closed indefinitely.9

“Smart Control” and Electronic Warfare

Iran’s physical A2/AD infrastructure is augmented by advanced electronic warfare (EW) and drone capabilities. Just prior to the outbreak of the war, in February 2026, the IRGCN conducted a large-scale exercise explicitly branded as “Smart Control of the Strait of Hormuz”.15 This drill showcased the integration of artificial-intelligence-based guidance systems for cruise missiles designed to counter electronic interference, alongside the deployment of roaming Shahed attack drones and the naval variant of the “Seyed-3” surface-to-air missile, which provides a regional air defense umbrella over IRGCN assets.16

The conflict has also seen a severe degradation of the electromagnetic spectrum. The proliferation of GPS spoofing and signal jamming in the region poses an extreme hazard to civilian navigation.18 Modern merchant vessels rely entirely on Global Navigation Satellite Systems (GNSS). When these signals are spoofed, large, slow-to-maneuver vessels can appear to be miles off course, increasing the catastrophic risk of collisions or groundings in the narrow channels of the Strait.18

The Commercial Paralysis: Safety, Insurance, and the “Tehran Toll Booth”

The physical threat posed by Iranian munitions represents only the kinetic dimension of the blockade. The ultimate enforcement mechanism of the Strait’s closure is commercial. Before the IRGCN actively began striking large numbers of tankers, the Strait had already been effectively closed by the structural logic of global maritime commerce, marine insurance, and institutional risk aversion.20

The Weaponization of Maritime Insurance

Within 48 hours of the initial U.S.-Israeli airstrikes on February 28, the marine insurance market reacted violently.20 War risk premiums surged from nominal peacetime levels to between 5 and 10 percent of a vessel’s total hull value.21 For a Very Large Crude Carrier (VLCC), a single transit could incur millions of dollars in additional premium costs alone. Consequently, major marine insurers issued 72-hour cancellation notices on existing war risk extensions, and the Lloyd’s Joint War Committee (JWC) redesignated the entire Arabian Gulf, Gulf of Oman, and adjacent corridors as active conflict zones.20

However, the narrative that the Strait is closed purely because insurance is unavailable is technically inaccurate. The Lloyd’s Market Association (LMA) issued formal statements clarifying that marine war insurance cover remains robustly available within the London market.23 A market survey indicated that 88 percent of main participants in the Lloyd’s marine war market retain the appetite to underwrite hull war risks, and over 90 percent will underwrite cargo.23 Furthermore, liability coverage through Protection and Indemnity (P&I) Clubs remains non-cancellable.23

The LMA firmly asserts that the primary driver halting commercial traffic is acute safety concerns held by shipowners and masters, not the lack of insurance capacity.23 Operators are making rational commercial decisions based on extreme operational hazards. The conflict has already exacted a heavy human and material toll; there have been at least 11 confirmed seafarer fatalities, tugboats have been sunk while attempting salvage operations, and dozens of merchant ships have been damaged or abandoned (including the MT Skylight, MKD Vyom, and the UAE-flagged Mussafah 2).1 Ships stranded in the region face depleting bunkers, while chemical tankers report running dangerously low on stabilizers required to prevent hazardous cargoes from degrading.23 Given the high probability of targeted strikes, shipowners are simply unwilling to risk total asset loss, catastrophic environmental pollution, and crew fatalities, regardless of whether an underwriter is willing to write a policy.

The Extortionary “Tehran Toll Booth” Regime

In the vacuum created by the withdrawal of standard commercial shipping, Iran has implemented a highly formalized, extortionary transit system recognized by maritime intelligence agencies as the “Tehran Toll Booth”.24 This system forces vessels to abandon standard international traffic separation schemes and navigate exclusively through a tightly controlled corridor within Iranian territorial waters, specifically passing between Qeshm and Larak Islands.24

The operational mechanics of this system are rigorous, demonstrating Iran’s transition from mere disruption to managed exploitation. Vessel operators seeking passage must first contact approved intermediaries with direct connections to the IRGC.25 Operators are required to submit a comprehensive documentation package, which includes the ship’s IMO number, the full corporate ownership chain, the cargo manifest, the final destination, and a complete crew list.25 These intermediaries forward the intelligence to the IRGC Navy’s Hormozgan Provincial Command, which conducts “geopolitical vetting,” sanctions screening, and cargo alignment checks—currently prioritizing the export of oil over all other commodities.25

If a vessel passes this geopolitical screening, the IRGC issues a specific clearance code and strict route instructions. Upon approaching the corridor, the vessel is hailed over VHF radio for code verification, after which an IRGC pilot boat is dispatched to physically escort the ship through the Larak Island detour.25

In exchange for this “safe passage,” Iran extracts exorbitant sovereign fees. Intelligence confirms that vessels are being charged up to US$2 million per transit, with payments actively brokered by maritime service companies and settled covertly in Chinese yuan.6 Iranian parliamentarians are actively drafting legislation to permanently formalize these tolls as a new “sovereign regime” over the waterway.6

This system has effectively bifurcated the global shipping industry. Western operators are entirely excluded from the corridor, or actively refuse to participate due to the severe, multi-jurisdictional legal risks.25 The IRGC is designated as a Foreign Terrorist Organization (FTO) by the U.S. State Department. Under U.S. law, providing “material support”—including the payment of transit tolls—to a designated FTO carries massive civil, regulatory, and criminal liabilities.25 Consequently, no cargoes transiting under the toll system have been destined for the United States or European markets.6

Shadow Fleets, AIS Spoofing, and Sanctions Evasion

To exploit the toll corridor while attempting to mitigate international scrutiny, a complex ecosystem of sanctions evasion and identity spoofing has accelerated. A shadow fleet of “zombie tankers” has emerged, utilizing sophisticated AIS spoofing to impersonate decommissioned or scrapped vessels.24 For example, a vessel assumed the digital identity of the Japan-flagged LNG carrier LNG Jamal (which was recycled in Alang, India in late 2025) to exit the Middle East Gulf via the Larak detour.24 Another vessel impersonated the aframax Nabiin (broken up in Chittagong in 2021), utilizing its IMO number while transmitting a Mozambique flag and the false name Nature Heart.24

While Western fleets remain paralyzed, China-affiliated vessels and Indian bulk carriers have actively utilized the detour, heavily backed by state-level diplomatic intervention.24 A Chinese-owned feeder containership, the Newvoyager, became the first confirmed vessel with mainland Chinese ownership to pay for passage through the corridor, utilizing a Chinese maritime services company as a payment intermediary.24 To signal compliance to Iranian coastal forces, vessels have begun broadcasting their strategic alignment directly into their AIS transmissions, with the Newvoyager broadcasting “DUQM ALL CREW CHINA” during its transit.24

India has also leveraged intense diplomatic backchannels to secure the release of its critical energy supplies. This diplomatic effort was operationalized by the Indian Navy under the banner of Operation Urja Suraksha.27 Deploying more than five frontline warships, including advanced destroyers and frigates, the Indian Navy successfully guided high-priority, India-bound vessels carrying liquefied petroleum gas (LPG)—including the Jag Vasant, Pine Gas, Shivalik, and Nanda Devi, alongside the crude tanker Jag Laadki—out of the danger zone.27 While highly successful for India, this operation underscores that transit is currently reliant on bilateral appeasement of Tehran rather than the enforcement of international maritime law.

Global Macroeconomic Contagion: The Collapse of the Commodity Supply Chain

The strategic implications of the Strait of Hormuz closure extend far beyond regional security; the blockade has precipitated a systemic shock to the global macroeconomic order. Traffic through the corridor—which normally accommodates upwards of 150 vessels per day—collapsed by over 97 percent following the outbreak of hostilities, with only 116 total transits recorded between March 1 and March 25.6

The primary casualty has been the global energy market. The Strait is the conduit for approximately 20 million barrels of oil per day (representing 20 percent of global consumption) and 20 percent of the world’s liquefied natural gas (LNG) trade.1 The sudden removal of this capacity triggered historic volatility.

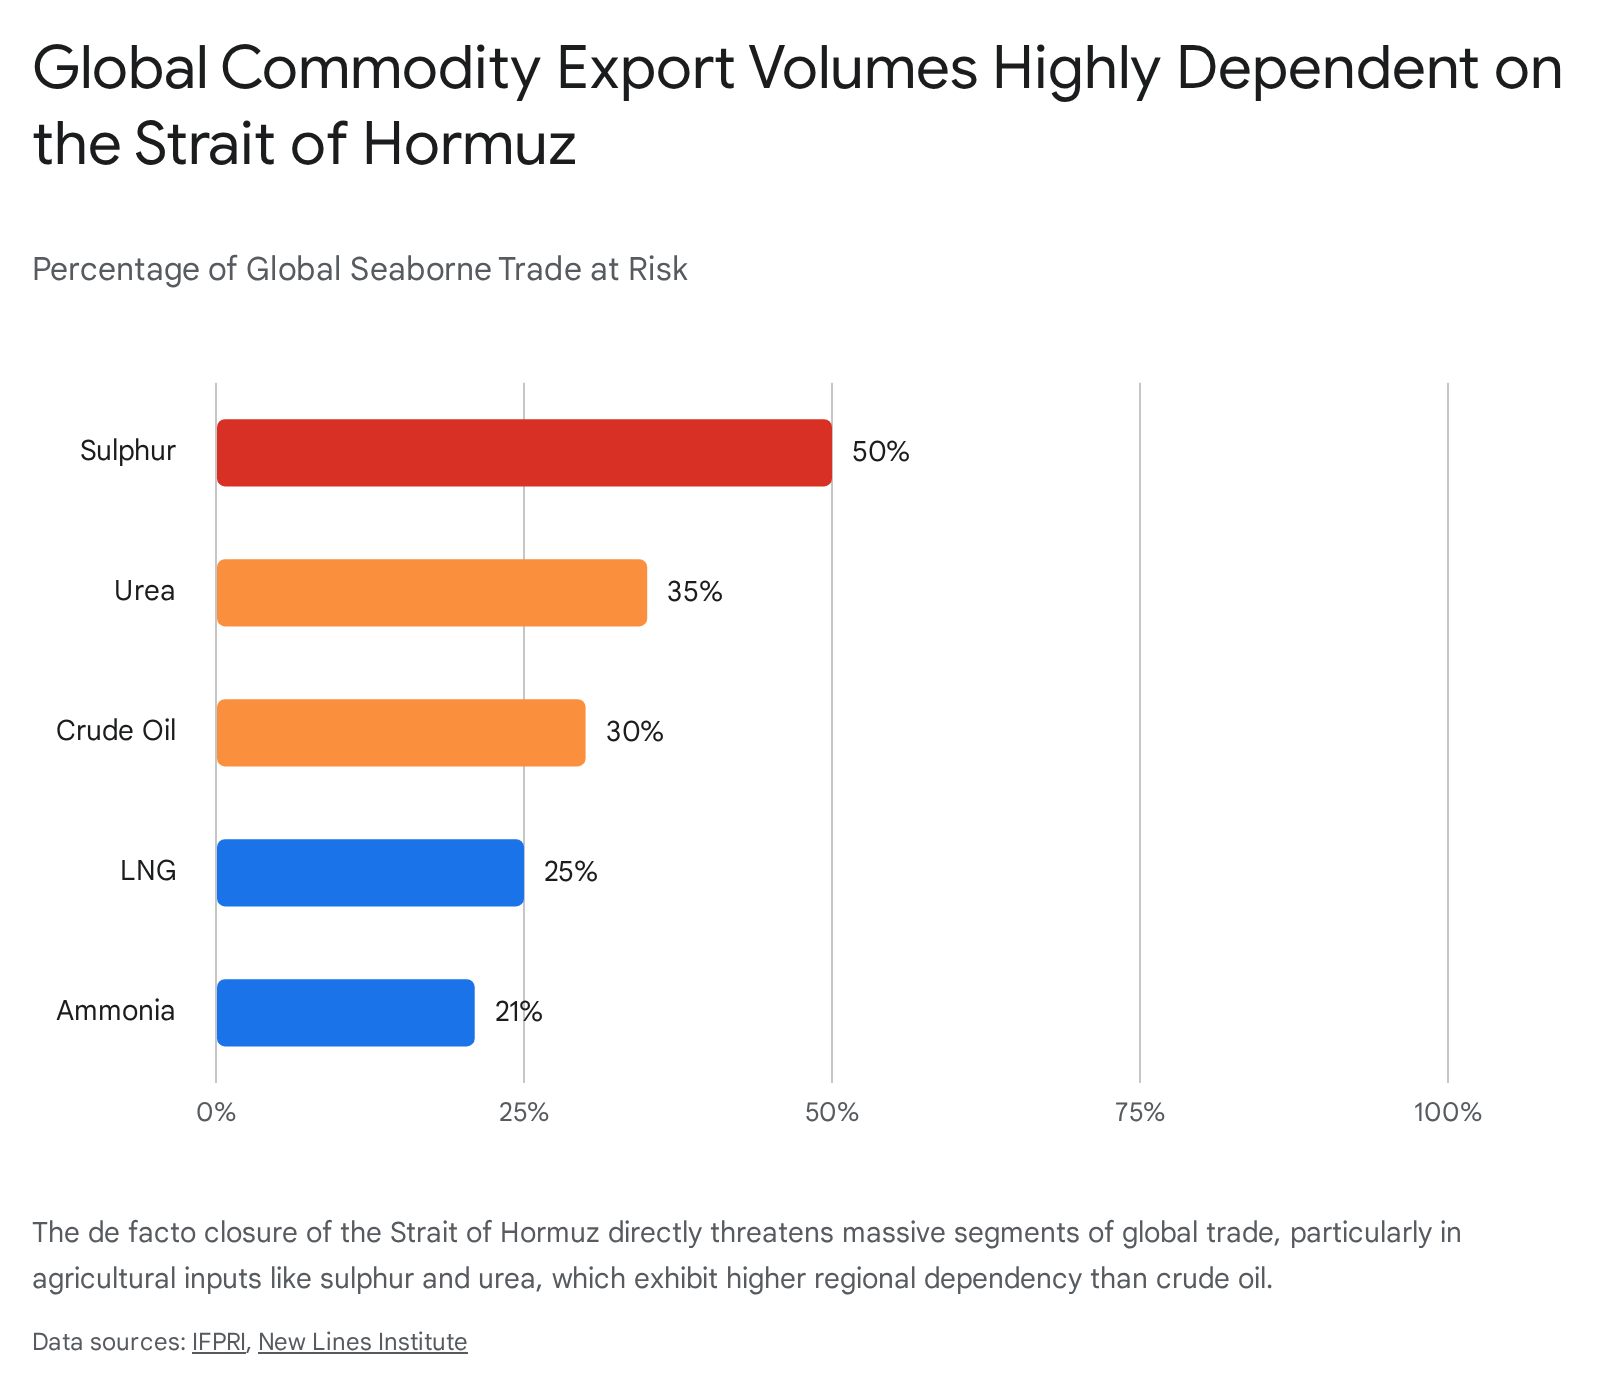
The economic devastation, however, is not limited to hydrocarbons. The crisis has triggered a massive contagion effect across global agricultural and industrial supply chains, threatening food security and industrial production in highly vulnerable, import-dependent nations.

The Agricultural Crisis: Fertilizers and Food Security

The Persian Gulf region is a structural pillar of the global agricultural sector, accounting for nearly 50 percent of the global sulfur trade (a critical input for phosphate fertilizers) and roughly one-third of all seaborne fertilizer exports.6 The sudden blockage of these materials has generated an immediate crisis for the spring planting season in the Northern Hemisphere.

The economic metrics clearly illustrate the severity of the supply shock:

Economic IndicatorPre-Conflict Baseline (Early Feb 2026)Peak Crisis Level (March 2026)Percentage Change / Impact
Daily Strait Transits~150 vessels/dayNear zero (~4-5/day)>97% Collapse in Volume
Brent Crude Oil Price~$70 – $81 USD/barrel$126 USD/barrel~55% – 80% Increase
Urea Fertilizer (May Contract)~$405 USD/metric ton$681 USD/metric ton68% Increase
Corn-to-Urea Purchasing Power125 bushels for 1 ton of Urea (2022 levels)145 bushels for 1 ton of UreaSevere margin compression for growers

The downstream effects of this fertilizer shock are profound. The United States Department of Agriculture (USDA) projects that soaring input costs will push corn planting expenses to US150 per acre for American growers.6 Compounding the price issue is absolute physical scarcity; approximately 25 percent of American growers were unable to secure fertilizer deliveries for spring planting, a situation the U.S. Secretary of Agriculture has escalated to a “national security issue”.6

Globally, the Food and Agriculture Organization (FAO) projects that fertilizer costs could average 15 to 20 percent higher throughout the first half of 2026.6 The UN World Food Programme has issued dire warnings that tens of millions of people in vulnerable, import-dependent nations will face acute hunger if the supply chains remain severed through June.30

Industrial Supply Chains: Aluminum, Helium, and Plastics

The blockade has also severed the flow of critical industrial commodities. The Middle East supplies between 10 and 20 percent of the polyethylene and polypropylene utilized in food packaging and medical supplies across Europe and Asia.6 Furthermore, nations like Turkey—which alone imports up to US2 billion in plastic raw materials, and a fifth of its helium from the Gulf states annually—are facing severe industrial rationing.29 The disruption to helium is particularly threatening to the global semiconductor manufacturing industry, which relies heavily on Qatari exports.1 The Kiel Institute for the World Economy projects that prolonged disruption will result in severe welfare losses (up to 5.49 percent) and potential deindustrialization in highly exposed economies.6

Expanded Theater: The Bab al-Mandab and the Houthi Wildcard

Compounding the strategic nightmare in the Strait of Hormuz is the horizontal escalation of the conflict into the Red Sea corridor. As of March 28, 2026, the Yemen-based Houthi movement—a core constituent of Iran’s Axis of Resistance—officially joined the war, launching their first direct ballistic missile and drone attacks against southern Israeli military sites and the city of Tel Aviv.31

The Houthi entry into the conflict poses an extreme threat to the Bab al-Mandab Strait. With the Strait of Hormuz effectively closed, global shipping companies and Gulf energy exporters (particularly Saudi Arabia) had increasingly diverted their oil shipments via the East-West pipeline to Red Sea ports like Yanbu to bypass the Iranian blockade.33 The Houthis have now threatened to impose a secondary naval blockade on the Red Sea, specifically targeting vessels belonging to “aggressor countries”.34

This creates a scenario where vessels are trapped between two hostile chokepoints. If the Houthis successfully degrade traffic through the Bab al-Mandab—a route that ordinarily handles US$1 trillion worth of goods annually—the logistical rerouting around the Cape of Good Hope will further inflate global freight rates, stretch supply lines, and compound the macroeconomic damage already inflicted by the Hormuz closure.32 The presence of Houthi missiles also immensely complicates the deployment of U.S. naval assets, forcing Carrier Strike Groups to operate under continuous threat of asymmetric attack from multiple vectors.

Strategic Countermeasures: Five Scenarios for the U.S. and Allies

Faced with a degraded but deeply entrenched Iranian A2/AD network, the paralyzing weaponization of commercial insurance, and the threat of a two-front chokepoint war, the United States and its allies must evaluate pathways to restore global maritime trade. The following five strategic scenarios are ranked from the most likely to be effective and sustainable, to the least.

1. Diplomatic Corridors and Overland Pipeline Bypasses (Most Effective)

What would be done:

This scenario abandons the immediate, high-risk military objective of forcing the Strait open via naval confrontation. Instead, it focuses on structurally bypassing the chokepoint through infrastructure maximization while establishing UN-mediated diplomatic trade corridors.

Economically, this strategy requires maximizing the throughput of existing pipeline infrastructure to circumvent Hormuz entirely. This includes the Saudi East-West Crude Oil Pipeline (Petroline), which can move up to 7 million barrels per day to the Red Sea port of Yanbu, and the UAE’s Abu Dhabi Crude Oil Pipeline (ADCOP), which can transport 1.5 million barrels per day directly to Fujairah on the Gulf of Oman.36 Furthermore, the Kirkuk-Ceyhan pipeline in Iraq offers an alternative route to the Mediterranean.38

Simultaneously, the international community relies on the newly established United Nations Task Force, led by UN Under-Secretary-General Jorge Moreira da Silva.39 Utilizing representatives from the UN Conference on Trade and Development (UNCTAD), the International Maritime Organization (IMO), and the International Chamber of Commerce (ICC), this task force aims to operationalize a diplomatic mechanism to guarantee the safe, non-politicized movement of humanitarian goods and fertilizers.39 This mechanism draws direct inspiration from the successful Black Sea Grain Initiative and the UN Verification, Inspection and Monitoring Mechanism for Yemen (UNVIM).39

The Results: While overland pipelines cannot entirely replace the 20 million barrels per day normally transiting the Strait, maximizing the 10–15 million bpd capacity of combined bypass routes significantly blunts the global energy shock and stabilizes baseline supply.36 More importantly, the UN diplomatic mechanism provides a face-saving, internationally legitimate off-ramp for Iran. By allowing agricultural and humanitarian commodities to flow under UN monitoring, it bypasses the extortionary “Tehran Toll Booth” and prevents the IRGC from enriching itself via illicit transit fees.25 It effectively de-weaponizes the Strait without requiring kinetic escalation.

Further Investigation:

Highly recommended. The U.S. and allied partners should immediately fund urgent capital investment feasibility studies to rapidly expand the pumping capacity of the ADCOP and East-West pipelines. Furthermore, intensive diplomatic support must be thrown behind the UN Task Force, with Secretary-General envoy Jean Arnault leading negotiations to finalize the legal and operational framework required to prevent the impending global agricultural famine.

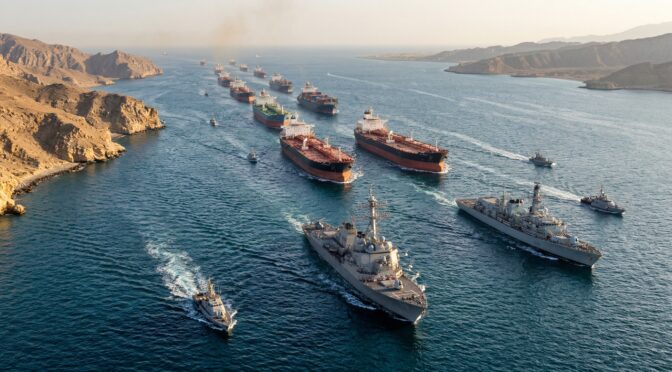
2. Multinational Stand-Off “Overwatch” Operations

What would be done: Led by the United Kingdom and France, a broad coalition of up to 35 nations forms an “overwatch” maritime security mission, independent of U.S. command structures.40 Unlike direct escort operations, this coalition strictly avoids entering the highly constricted, mine-threatened, and missile-locked waters of the Middle East Gulf.

Instead, naval assets—coordinated by French Armed Forces Chief Fabien Mandon and UK Chief of the Defense Staff Sir Richard Knighton—remain stationed in the Gulf of Oman and the Arabian Sea.40 Utilizing advanced radar, autonomous minehunting drones, and long-range interceptors, the coalition provides a defensive umbrella over the approaches to the Strait.24

The Results: This scenario creates a sanitized staging area and protects merchant vessels immediately before and after their transit through the highest-risk zone. It successfully demonstrates international resolve and secures the outer maritime perimeter without presenting highly vulnerable, concentrated naval targets to IRGCN coastal batteries and drone swarms.41 However, the French Defense Ministry has explicitly stated that the mission’s purpose is to organize the resumption of shipping once hostilities have ceased.41 Therefore, while it mitigates threats on the periphery, it relies heavily on a prior de-escalation of the U.S.-Israel-Iran conflict and does not solve the core, immediate issue of vessels having to run the gauntlet of the 21-mile-wide chokepoint unescorted today.

Further Investigation:

Moderately recommended. The diplomatic consensus-building is highly valuable, and deploying autonomous minehunting systems from stand-off ranges reduces human risk while addressing the psychological fear of unlocated bottom mines. However, policymakers must recognize it is a preparatory half-measure that does not fundamentally break the immediate A2/AD bubble over the Strait itself.

3. State-Backed Reinsurance and Targeted Naval Escorts

What would be done: This scenario attempts to address the commercial paralysis directly through sovereign financial intervention combined with hard military force. The U.S. International Development Finance Corporation (DFC), acting as a sovereign backstop and partnering with lead underwriter Chubb, provides a massive US$20 billion maritime reinsurance facility for qualified vessels.43 Because private insurers view the risk of a VLCC loss as catastrophically uninsurable without state backing, the U.S. government absorbs the extreme financial risk to lower war risk premiums to acceptable levels.43

To mitigate the physical threats that would trigger these massive insurance payouts, vessels utilizing this DFC insurance are escorted in heavily defended convoys by the U.S. Navy and allied forces.43 This operates under a doctrine similar to the 1980s Operation Earnest Will during the Tanker War, where U.S. warships physically shielded reflagged Kuwaiti tankers.45

The Results: Financially, the DFC’s $20 billion reinsurance program successfully provides the necessary market confidence for shipowners to legally operate, directly circumventing the IRGC’s extortion ring.43 However, the military component is highly problematic. Internal U.S. Navy assessments have concluded that widespread, routine escort operations in the current threat environment are “too dangerous”.47 The risk of drone swarms, remote-controlled explosive boats, and unlocated bottom mines overwhelming a destroyer’s defenses in such narrow waters is unacceptably high.47 The interceptor math remains highly unfavorable; emptying a multi-million-dollar VLS magazine to defend a commercial tanker against cheap Shahed drones is a losing attritional strategy.10 Therefore, while a massive U.S. escort program guarantees transit, it actively invites direct, high-casualty engagements with Iranian asymmetric forces.

Further Investigation: Recommended, but with extreme operational caution. The DFC’s reinsurance program is a necessary economic tool to combat the weaponization of insurance. However, U.S. lawmakers, including Senator Jeanne Shaheen, have rightly raised concerns about exposing U.S. taxpayers to massive liabilities, particularly if the escorted oil ultimately benefits strategic competitors like China.48 The rules of engagement and the sheer volume of required naval assets for continuous escorting must be strictly evaluated by CENTCOM to avoid catastrophic loss of a major surface combatant.

4. Comprehensive Cyber and Electronic Warfare (EW) Suppression

What would be done: The United States and Israel escalate non-kinetic, multi-domain operations to completely blind and disorient the IRGC’s targeting complex. This involves the mass deployment of GPS spoofing, widespread radar jamming, and offensive cyberattacks targeting command nodes such as the IRGC Navy 2nd Nouh-e Nabi Region Headquarters in Bushehr, as well as the communications infrastructure deeply buried on the Nazeat Islands.13 The objective is to sever the command-and-control links between Iranian coastal batteries, drone operators, and their targets, rendering their anti-ship cruise missiles useless.

The Results: Disrupting the electromagnetic spectrum temporarily degrades Iran’s ability to coordinate sophisticated, multi-vector swarm attacks or utilize AI-guided munitions. However, the secondary effects are severe. The maritime environment in the region is already suffering from heavy GNSS interference. Blanketing the Strait in intense electronic warfare makes civilian navigation exponentially more dangerous. As seen with the grounding of the MSC Antonia in the Red Sea due to GPS spoofing, removing reliable navigational data causes large, slow-to-maneuver vessels to appear miles off course, radically increasing the risk of collisions or groundings in the narrow, shallow channels of the Strait.18 More critically, EW does absolutely nothing to neutralize the Maham 3 and Maham 7 acoustic and magnetic naval mines already deployed in the water, which operate independently of RF command links.13

Further Investigation:

Warrants investigation as a strictly supplemental, highly targeted tactical tool, but it cannot serve as a primary strategic solution. While blinding Iranian radar is tactically sound prior to a specific transit, indiscriminately increasing electronic interference in a narrow waterway makes civilian navigation hazardous, ironically increasing the exact safety concerns that are keeping insurers and shipowners away from the region.

5. Littoral Occupation and Escalation to Total War (Least Effective)

What would be done: Based on the unyielding premise that naval power alone cannot secure a narrow strait against a hostile shore, the U.S. military commits to a massive amphibious and airborne ground invasion to physically occupy the Iranian littoral. This would require securing over 150 kilometers of mountainous, heavily fortified coastline, stretching from Qeshm Island past Bandar Abbas to Jask.10 U.S. Marines and the 82nd Airborne Division would be tasked with physically dismantling the subterranean coastal defense cruise missile (CDCM) sites, bunker complexes, and artillery positions yard by yard.10

The Results: This represents the “Ghost of Gallipoli” scenario realized.10 It would result in a catastrophic strategic overextension for the United States. Occupying the Iranian coastline offers no defensible depth; U.S. forces would be pinned against the sea, subjected to continuous, attritional guerrilla warfare and ballistic missile strikes from interior Iranian lines.10

Furthermore, such a massive escalation would trigger total regional destabilization. It would invite direct intervention or massive logistical resupply of Iranian forces by the Russian Federation via the Caspian Sea—a supply line the U.S. cannot interdict without initiating a direct conflict with Russian forces.10 The operation would result in unacceptable U.S. casualties, likely fracture the NATO alliance, and ensure the permanent destruction of the region’s energy infrastructure. The political, economic, and human costs would vastly outweigh the benefits of reopening the Strait.

Further Investigation:

Should not be investigated under any circumstances. It represents a fundamental failure of strategic cost-benefit analysis and ignores the painful historical lessons of asymmetrical warfare in constricted littoral environments against highly motivated, ideologically entrenched defenders.

Conclusion

The 2026 Strait of Hormuz crisis vividly demonstrates that in constricted maritime geography, asymmetric area-denial capabilities inherently outmatch conventional naval power projection. The joint U.S.-Israeli Operation Epic Fury succeeded brilliantly in devastating Iran’s conventional military infrastructure, decapitating its leadership, and sinking its blue-water fleet, but it fundamentally failed to secure the maritime commons. By leveraging low-cost mines, impenetrable coastal geography, and the structural, risk-averse nature of global marine insurance, Iran has successfully weaponized the global supply chain. It has held agricultural and energy markets hostage through its extortionary “Tehran Toll Booth” regime, effectively achieving strategic paralysis without requiring a traditional navy.

Because kinetic naval solutions are either deemed “too dangerous” by internal U.S. Navy assessments or invite catastrophic, Gallipoli-style escalation, the path forward must creatively circumvent the tactical deadlock. The United States and its international partners must prioritize structural bypasses—maximizing overland pipeline capacities—while simultaneously throwing full diplomatic weight behind the UN Task Force’s mechanisms to secure the movement of vital agricultural commodities. Breaking the blockade will ultimately not be achieved by sinking more Iranian fast attack craft, but by rendering the Strait of Hormuz strategically and economically irrelevant through diversified infrastructure and robust, state-backed financial countermeasures.


Please share the link on Facebook, Forums, with colleagues, etc. Your support is much appreciated and if you have any feedback, please email us in**@*********ps.com. If you’d like to request a report or order a reprint, please click here for the corresponding page to open in new tab.


Sources Used

  1. 2026 Strait of Hormuz crisis – Wikipedia, accessed March 28, 2026, https://en.wikipedia.org/wiki/2026_Strait_of_Hormuz_crisis
  2. Operation Epic Fury Situation Report | Battlefield Effects and Early Strategic Signals, accessed March 28, 2026, https://www.hudson.org/missile-defense/operation-epic-fury-situation-report-battlefield-effects-strategic-outcomes-can-kasapoglu
  3. Interim Assessment: Evaluating the Strategic Damage Caused to Iran in Operation “Roaring Lion” (Week 3 – March 21), accessed March 28, 2026, https://israel-alma.org/interim-assessment-evaluating-the-strategic-damage-caused-to-iran-in-operation-roaring-lion-week-3-march-21/
  4. What They’re Saying About Operation Epic Fury—March 26, 2026 | UANI, accessed March 28, 2026, https://www.unitedagainstnucleariran.com/press-releases/what-theyre-saying-about-operation-epic-fury-march-26-2026
  5. Iran Update Special Report, March 17, 2026 – Institute for the Study of War, accessed March 28, 2026, https://understandingwar.org/research/middle-east/iran-update-special-report-march-17-2026/
  6. Tehran’s “toll booth” in Hormuz cuts Western buyers out of fertilizer …, accessed March 28, 2026, https://www.foodingredientsfirst.com/news/hormuz-toll-fertilizer-food-costs.html
  7. Operation Epic Fury | U.S. Department of War, accessed March 28, 2026, https://www.war.gov/Spotlights/Operation-Epic-Fury/
  8. Operation Epic Fury and the Collapse of Iran’s Layered Naval Defense, accessed March 28, 2026, https://gulfif.org/operation-epic-fury-and-the-collapse-of-irans-layered-naval-defense/
  9. Top Eight Iranian Weapons That Could Shut the Strait of Hormuz Indefinitely — Inside Tehran’s A2/AD Arsenal Threatening Global Oil Supply and Naval Power Balance – Defence Security Asia, accessed March 28, 2026, https://defencesecurityasia.com/en/iran-weapons-strait-of-hormuz-shutdown-a2ad-mines-missiles-irgc-navy-oil-supply-threat/
  10. Ghost of Gallipoli: US warships cannot control the Strait of Hormuz …, accessed March 28, 2026, https://www.aspistrategist.org.au/ghost-of-gallipoli-us-warships-cannot-control-the-strait-of-hormuz/
  11. Hormuz Flashpoint 2026: The Siege of the World’s Energy Jugular and the Rise of the Tri-Lateral Naval Bloc – https://debuglies.com, accessed March 28, 2026, https://debuglies.com/2026/02/18/hormuz-flashpoint-2026-the-siege-of-the-worlds-energy-jugular-and-the-rise-of-the-tri-lateral-naval-bloc/
  12. Iran does not need to close the Strait of Hormuz to disrupt it – Al Jazeera, accessed March 28, 2026, https://www.aljazeera.com/opinions/2026/3/20/iran-does-not-need-to-close-the-strait-of-hormuz-to-disrupt-it
  13. Iran Update Special Report, March 24, 2026 | ISW, accessed March 28, 2026, https://understandingwar.org/research/middle-east/iran-update-special-report-march-24-2026/
  14. Iran Update Morning Special Report, March 11, 2026 | ISW, accessed March 28, 2026, https://understandingwar.org/research/middle-east/iran-update-morning-special-report-march-11-2026/
  15. Iran’s Ultra-Professional Drill in the Strait of Hormuz – YouTube, accessed March 28, 2026, https://www.youtube.com/watch?v=bG6JbawPbjM
  16. Iranian Naval Drill in the Strait of Hormuz Showcases New Missile and Drone Capabilities -, accessed March 28, 2026, https://wanaen.com/iranian-naval-drill-in-the-strait-of-hormuz-showcases-new-missile-and-drone-capabilities/
  17. Iran Update, February 24, 2026 | ISW, accessed March 28, 2026, https://understandingwar.org/research/middle-east/iran-update-february-24-2026/
  18. When GPS Lies at Sea: How Electronic Warfare is Threatening Ships and Their Crews, accessed March 28, 2026, https://news.gatech.edu/news/2026/03/12/when-gps-lies-sea-how-electronic-warfare-threatening-ships-and-their-crews
  19. Maritime security update: Gulf Region / Strait of Hormuz and Red Sea – Skuld, accessed March 28, 2026, https://www.skuld.com/topics/port/port-news/asia/maritime-security-update-gulf-region–strait-of-hormuz-and-red-sea/
  20. The Insurance Weapon: How Commercial Risk Logic Became an Irregular Warfare Tool at Hormuz, accessed March 28, 2026, https://irregularwarfare.org/articles/insurance-weapon-irregular-warfare-hormuz/
  21. China Sails Through Hormuz as Iran Blocks the World – House of Saud, accessed March 28, 2026, https://houseofsaud.com/china-cosco-hormuz-blockade-iran-selective-shipping/
  22. Maritime Terms Explained: Iran War & Strait of Hormuz Crisis – Windward, accessed March 28, 2026, https://windward.ai/blog/maritime-terms-explained-iran-war/
  23. Safety concerns, not insurance availability, driving reduced vessel traffic in the Strait of Hormuz – Lloyd’s Market Association, accessed March 28, 2026, https://lmalloyds.com/safety-concerns-not-insurance-availability-driving-reduced-vessel-traffic-in-the-strait-of-hormuz/
  24. ‘Zombie’ tankers take Tehran Toll Booth route as more vessels make detour – Lloyd’s List, accessed March 28, 2026, https://www.lloydslist.com/LL1156694/Zombie-tankers-take-Tehran-Toll-Booth-route-as-more-vessels-make-detour
  25. Tehran’s ‘toll booth’ system is now controlling Hormuz traffic :: Lloyd’s …, accessed March 28, 2026, https://www.lloydslist.com/LL1156720/Tehrans-toll-booth-system-is-now-controlling-Hormuz-traffic
  26. Tehran’s ‘toll booth’ system is now controlling Hormuz traffic, accessed March 28, 2026, https://mykn.kuehne-nagel.com/news/article/tehrans-toll-booth-system-is-25-mar-2026
  27. Indian Navy launches op to secure energy vessels in Strait of Hormuz amid war, accessed March 28, 2026, https://www.indiatoday.in/india/story/middle-east-war-indian-navy-launches-op-urja-suraksha-to-secure-energy-vessels-in-strait-of-hormuz-2886733-2026-03-25
  28. Indian Navy Launches ‘Operation Urja Suraksha’ To Secure India-Bound Ships Passing Through Strait of Hormuz, accessed March 28, 2026, https://www.marineinsight.com/indian-navy-launches-operation-urja-suraksha-to-secure-india-bound-ships-passing-through-strait-of-hormuz/
  29. Deep Dive: Strait of Hormuz’s Closure Will Hit Every Economy, accessed March 28, 2026, https://inkstickmedia.com/deep-dive-strait-of-hormuzs-closure-will-hit-every-economy/
  30. UN moves to create mechanism to safeguard Hormuz trade in face of Iran war By Reuters, accessed March 28, 2026, https://m.investing.com/news/world-news/un-moves-to-create-mechanism-to-safeguard-hormuz-trade-in-face-of-iran-war-4585778?ampMode=1
  31. Iran-Israel war LIVE: Israel says it intercepted first incoming missile from Yemen as war in West Asia intensifies, accessed March 28, 2026, https://www.thehindu.com/news/international/iran-israel-us-war-west-asia-conflict-strait-of-hormuz-attacks-march-28-2026/article70795241.ece
  32. US-Israel-Iran War Live: Yemen’s Houthis join Iran war for first time, launch missiles at Israel, accessed March 28, 2026, https://www.indiatoday.in/world/story/us-israel-iran-war-live-updates-middle-east-crisis-conflict-strait-of-hormuz-2887660-2026-03-27
  33. The Yemeni Front of the War: The Houthi Wild Card – Gulf International Forum, accessed March 28, 2026, https://gulfif.org/the-yemeni-front-of-the-war-the-houthi-wild-card/
  34. Red Sea crisis – Wikipedia, accessed March 28, 2026, https://en.wikipedia.org/wiki/Red_Sea_crisis
  35. Yemen’s Houthis claim responsibility for missile attack on Israel, their first since war started, accessed March 28, 2026, https://apnews.com/article/iran-us-israel-trump-lebanon-march-27-2026-195444c54cbb7545d0a77f8ffbc0e4c0
  36. How to make the Strait of Hormuz irrelevant, accessed March 28, 2026, https://www.washingtonpost.com/opinions/2026/03/25/iran-hormuz-energy-pipeline-bypass/
  37. Strait of Hormuz – About – IEA, accessed March 28, 2026, https://www.iea.org/about/oil-security-and-emergency-response/strait-of-hormuz
  38. Hormuz crisis: Why Gulf’s energy export alternatives remain limited, accessed March 28, 2026, https://www.aa.com.tr/en/economy/hormuz-crisis-why-gulf-s-energy-export-alternatives-remain-limited/3877060
  39. Note to Correspondents: on the Strait of Hormuz | Secretary-General – the United Nations, accessed March 28, 2026, https://www.un.org/sg/en/content/sg/notes-correspondents/2026-03-27/note-correspondents-the-strait-of-hormuz
  40. UK to host talks on mission to reopen Hormuz: Official – Courthouse News Service, accessed March 28, 2026, https://courthousenews.com/uk-to-host-talks-on-mission-to-reopen-hormuz-official/
  41. France says it approached 35 countries over future Hormuz mission – KFGO, accessed March 28, 2026, https://kfgo.com/2026/03/26/france-says-it-approached-35-countries-over-future-hormuz-mission/
  42. Joint statement from the leaders of the United Kingdom, France, Germany, Italy, the Netherlands, Japan, Canada and others on the Strait of Hormuz: 19 March 2026 – GOV.UK, accessed March 28, 2026, https://www.gov.uk/government/news/joint-statement-from-the-leaders-of-the-united-kingdom-france-germany-italy-the-netherlands-and-japan-on-the-strait-of-hormuz-19-march-2026
  43. Trump Official Says Hormuz Ship Insurance Program to Launch …, accessed March 28, 2026, https://gcaptain.com/trump-official-says-hormuz-ship-insurance-program-to-launch-soon-as-tanker-traffic-struggles-to-recover/
  44. Chubb Outlines Structure of $20B Gulf Reinsurance Facility, Now Including Liability Cover, accessed March 28, 2026, https://www.insurancejournal.com/news/international/2026/03/23/863026.htm
  45. Operation Earnest Will – Wikipedia, accessed March 28, 2026, https://en.wikipedia.org/wiki/Operation_Earnest_Will
  46. The Hormuz Crisis: Why Controlling a Chokepoint is Harder Than Winning a War, accessed March 28, 2026, https://moderndiplomacy.eu/2026/03/28/the-hormuz-crisis-why-controlling-a-chokepoint-is-harder-than-winning-a-war/
  47. Behind Closed Doors, U.S. Navy Says Hormuz Escorts Are Too …, accessed March 28, 2026, https://gcaptain.com/behind-closed-doors-u-s-navy-says-hormuz-escorts-are-too-dangerous-for-now/
  48. US senator presses DFC on taxpayer risk in $20 billion maritime reinsurance proposal, accessed March 28, 2026, https://www.insurancebusinessmag.com/reinsurance/news/breaking-news/us-senator-presses-dfc-on-taxpayer-risk-in-20-billion-maritime-reinsurance-proposal-569928.aspx
  49. Iran’s Next Move: How to Counter Tehran’s Multidomain Punishment Campaign – CSIS, accessed March 28, 2026, https://www.csis.org/analysis/irans-next-move-how-counter-tehrans-multidomain-punishment-campaign
  50. US moves airborne troops, Marines as Iran rejects ceasefire, raising ground war potential, accessed March 28, 2026, https://www.wfmd.com/2026/03/25/us-moves-airborne-troops-marines-as-iran-rejects-ceasefire-raising-ground-war-potential/

Impact of the 2026 Gulf War on Global Supply Chains

1. Executive Overview and Geopolitical Context

The outbreak of the third Gulf War on February 28, 2026, initiated by joint United States and Israeli military operations under the designation Operation Epic Fury, has fundamentally altered the global economic and security landscape.1 The opening salvos targeted and eliminated key Iranian leadership figures, including Supreme Leader Ali Khamenei, which triggered a massive retaliatory wave of Iranian ballistic missiles and drone strikes across the Middle East.1 These retaliatory strikes have engaged military installations and deeply compromised civilian infrastructure, energy hubs, and commercial maritime routes across the Gulf Cooperation Council states, including the United Arab Emirates, Bahrain, Qatar, Kuwait, and Saudi Arabia.3

The defining geoeconomic consequence of the conflict thus far is the de facto closure of the Strait of Hormuz. While Iranian naval assets in the Gulf of Oman have suffered significant degradation from United States Central Command operations, the combination of kinetic drone strikes, elevated war risk insurance premiums, and massive electronic warfare operations has brought commercial transit to a virtual standstill.5 By early March 2026, maritime traffic through the Strait had plummeted by nearly 80 percent, with daily transits dropping from an average of 153 to as few as three per day.6 Advanced tracking indicates that automatic identification system signals are being heavily jammed or spoofed, causing vessels to cluster in holding patterns near Fujairah and the Gulf of Oman to avoid collision and missile threats.6

Foreign affairs and national security analysts observe that the crisis extends far beyond a bilateral military exchange. The conflict has exposed a fragmenting regional order where global powers are maneuvering for leverage. Intelligence reports suggest that Russia is sharing intelligence with Iran to support strikes against United States forces, highlighting a deepening cooperation between adversaries.8 Simultaneously, China is reportedly negotiating directly with Tehran for safe passage of its tankers through the closed strait, underscoring Beijing’s deep reliance on Middle Eastern energy.9 Inside Iran, the assassination of leadership has led to a succession crisis and the establishment of a ruling triumvirate, further complicating diplomatic off ramps.10

The resulting supply chain shock is unprecedented in its speed and scope. The Middle East remains the heart of the global energy and petrochemical system. The constriction of the Strait of Hormuz directly threatens 20 percent of the world’s daily oil supply, large segments of global liquefied natural gas exports, and massive portions of the global fertilizer and petrochemical trades.11 Consequently, global commodity markets have entered a state of extreme volatility. Energy, agricultural inputs, and industrial metals are experiencing sharp price spikes as buyers scramble to secure alternative sources.12 This report details the extent of the supply chain shocks across the top 10 most directly impacted industries, identifies regions with the capacity to absorb the displaced demand, and forecasts the timeframes required for alternative capacities to come online.

2. Macroeconomic Shifts and Systemic Trade Ruptures

The current conflict represents a structural geoeconomic rupture rather than a temporary logistical hurdle. The disruption of the Persian Gulf activates severe inflationary pressures across global supply chains. Economic analysis indicates that for energy importing powerhouses such as China and India, the sudden loss of Middle Eastern crude, liquefied natural gas, and chemical feedstocks drives up production costs for energy intensive manufacturing sectors.11 This input inflation squeezes profit margins and threatens global export competitiveness.11

Furthermore, the conflict has exposed the limitations of regional air defense architecture. While Gulf Cooperation Council states utilizing United States supplied Terminal High Altitude Area Defense systems and Patriot PAC-3 MSE interceptors have reported high interception rates against traditional ballistic missiles, the sheer volume of low cost Iranian Shahed drones has proven difficult to mitigate entirely.13 Debris from interceptions and direct hits have caused material damage to vital infrastructure, forcing companies like QatarEnergy and Aluminium Bahrain to declare force majeure on shipments.16

The resulting systemic trade rupture forces a rapid recalibration of global sourcing. Industries reliant on just in time delivery models for metals, chemicals, and fertilizers are now facing weeks of delays and exponentially higher freight costs.18 The global economy is pivoting toward a prioritization of supply chain resilience over pure cost efficiency, accelerating investments in alternative energy regions, domestic manufacturing, and green technologies.11

Strait of Hormuz commodity export dependency: Sulphur 50%, Urea 35%, Crude Oil 30%, LNG 25%, Ammonia 21%

3. Analysis of Top 10 Directly Impacted Industries

The 2026 Iranian Gulf War has created immediate supply deficits across multiple sectors. Energy sector and macroeconomic analysis provides a detailed examination of the top 10 most directly impacted industries, detailing the extent of the shock, alternative global capacities, and the realistic timeframes for market stabilization.

3.1. Crude Oil Markets and Global Petroleum Supply

The Middle East accounts for roughly 30 percent of global oil production and nearly half of all global seaborne oil exports.11 The closure of the Strait of Hormuz effectively traps nearly 20 million barrels per day inside the Persian Gulf.11 Consequently, crude oil prices reacted violently in the opening days of the war. Brent crude surged past the $100 per barrel threshold, eventually reaching peaks near $126 per barrel amid fears of prolonged shortages.20

While Saudi Arabia maintains some alternative export routes via Red Sea pipelines, elevated attacks by regional proxy groups have historically constrained these corridors.22 The burden of replacing this monumental supply deficit falls primarily on non OPEC+ producers in the Americas. Global supply growth is projected to be driven heavily by countries outside the immediate conflict zone, though the timeline for this capacity to offset the crisis varies significantly.23

Alternative Capacity and Activation Timeframes

The United States, Canada, Guyana, and Brazil hold the greatest capacity to bridge the supply gap, though their production increases are structural rather than immediate.

  • United States: The United States is forecast to lead global production growth, adding approximately 1.1 million barrels per day of capacity between 2024 and 2026.24 This growth is primarily driven by efficiencies in the Permian Basin in Texas and New Mexico.25 In December 2025, United States crude oil production hovered around 13.6 million barrels per day.26
  • Canada: Canadian production is set to increase by 0.5 million barrels per day by 2026.23 This growth is heavily supported by the Trans Mountain pipeline expansion, which adds 600,000 barrels per day of takeaway capacity to the Pacific coast.23 However, analysts note that by late 2026, pipeline constraints could reappear, potentially exerting downward pressure on local pricing.27
  • Brazil and Guyana: Offshore deepwater projects in South America are yielding significant output. Brazil is forecast to add 0.3 million to 0.48 million barrels per day by 2026, utilizing new floating production storage and offloading vessels.23 Notably, the startup of Equinor’s Bacalhau field has pushed Brazilian monthly production above 4.0 million barrels per day.28 Guyana is adding another 0.3 million barrels per day, bolstered by the Uaru development project expected to come online in 2026 following the success of the Yellowtail project.23
  • Argentina: Shale production from Argentina’s Vaca Muerta region increased to over 500,000 barrels per day in 2025.23 Argentina is estimated to grow its production by another 130,000 barrels per day in 2026 as local takeaway capacity bottlenecks are resolved.23
  • Venezuela: While Venezuela holds massive reserves, its capacity to rapidly pick up demand is severely restricted by deteriorated infrastructure, environmental compliance issues, and a lack of skilled labor.29 Venezuelan output will not immediately offset Gulf losses in 2026. However, if sanctions ease and transitional governance stabilizes the sector, heavy sour crude production could rise to over 1 million barrels per day between 2027 and 2030, and potentially up to 2.5 million barrels per day in the long term.30
Producing NationProjected Capacity Addition (2024 to 2026)Primary Growth DriverConstraint or Bottleneck
United States+ 1.1 million barrels per dayPermian Basin efficiencyCapital discipline and natural depletion in older basins
Canada+ 0.5 million barrels per dayTrans Mountain Pipeline expansionLooming pipeline capacity limits by late 2026
Brazil+ 0.3 to 0.48 million barrels per dayDeepwater offshore vesselsHigh upfront costs and long development timelines
Guyana+ 0.3 million barrels per dayUaru offshore development projectInfrastructure scaling
Argentina+ 0.13 million barrels per dayVaca Muerta shale expansionMidstream takeaway capacity
VenezuelaNegligible in 2026Sanctions relief and transitional governanceSevere infrastructure decay and labor shortages

In the short term, global markets must rely on strategic petroleum reserves and demand destruction caused by high prices. Meaningful alternative physical barrels from the Americas will continue to ramp up through the end of 2026, but they cannot fully replace a sustained physical blockade of the Persian Gulf.31 The resulting feedback loop of excess supply pressures in the Americas versus extreme deficits in Eurasia will create a highly fractured global oil market.

3.2. Liquefied Natural Gas Production and Distribution

The Middle East produces approximately 18 percent of the world’s natural gas and accounts for 20 to 30 percent of global liquefied natural gas exports.11 Qatar alone is responsible for nearly 20 percent of global liquefied natural gas supply.16 Following Iranian attacks on industrial centers and the closure of the Strait of Hormuz, QatarEnergy declared force majeure on all liquefied natural gas shipments in early March 2026.16 This massive supply extraction caused global natural gas prices to surge by over 40 percent, exacerbating an existing global gas market deficit.11

The disruption is particularly acute for European and Asian markets that heavily depend on continuous seaborne gas deliveries to fuel power grids and industrial heating operations. The sudden loss of Qatari volumes forces these regions to compete aggressively in the spot market for uncontracted cargoes.

Alternative Capacity and Activation Timeframes

The United States and Canada are the primary regions positioned to absorb this displaced demand, fueled by a wave of new export terminal completions and massive contracting activity. In 2025 alone, United States developers signed sale and purchase agreements for 40 million tons per annum of liquefied natural gas, equal to 5.2 billion cubic feet per day.33

  • United States Gulf Coast: United States capacity is expanding aggressively. The Department of Energy recently approved a 12 percent expansion at Cheniere Energy’s Corpus Christi terminal in Texas, raising its authorized export capacity to 4.45 billion cubic feet per day and making it the second largest export project in the nation.34 Furthermore, projects such as Plaquemines Phase 2 and Golden Pass are actively under construction.36 Total United States export capacity is projected to surge from roughly 14.3 billion cubic feet per day in 2025 to 23.5 billion cubic feet per day by 2030.38
  • Canada: Canada’s first major export terminal, LNG Canada in British Columbia, shipped its first cargo in late June 2025 and is slated to reach its full 1.84 billion cubic feet per day capacity in 2026.37 This West Coast location is highly strategic, as it reduces shipping times to Asian markets by 50 percent compared to United States Gulf Coast terminals.37 Additional projects like Woodfibre and Cedar will add further capacity by 2027 and 2028 respectively.37
  • Mexico: Developers are constructing two export projects in Mexico with a combined capacity of 0.6 billion cubic feet per day, including the Fast LNG Altamira floating production vessel off the east coast and Energia Costa Azul on the west coast.37
Export Facility ProjectLocationExport CapacityProjected Full Operational Timeline
Corpus Christi Stage 3 (Trains 8 & 9)Texas, United StatesUp to 4.45 billion cubic feet per day totalPhased ramp up through 2026
LNG Canada (Phase 1)British Columbia, Canada1.84 billion cubic feet per dayReaching full capacity in 2026
Golden PassTexas, United States2.1 billion cubic feet per dayFirst train expected mid-2026
Plaquemines (Phase 2)Louisiana, United States2.7 billion cubic feet per day (growing)Ramp up through 2026 into 2027
WoodfibreBritish Columbia, Canada0.3 billion cubic feet per dayExpected start in 2027
Cedar (Floating)British Columbia, Canada0.4 billion cubic feet per dayExpected start in 2028

While North America is constructing the capacity to replace Qatari gas, the timeframe is staggered. Terminals currently undergoing commissioning require three to six months to ramp up to full commercial operation.39 Therefore, Europe and Asia will face intense competition and severe price premiums for spot cargoes throughout 2026 until the North American capacity fully materializes and normalizes the market imbalance.

3.3. Methanol and Petrochemical Feedstocks

Methanol is a critical chemical building block globally. It is primarily utilized in the methanol to olefin process and in the synthesis of formaldehyde, which is essential for resins, plastics, adhesives, and construction materials.40 The Middle East is a dominant force in this sector, utilizing abundant low cost natural gas feedstocks to dominate the regional market.41 Saudi Arabia is the largest regional producer, while Iran is a massive exporter, shipping approximately 9 million tonnes annually, predominantly to China.41

The effective shut in of the Strait of Hormuz has stranded an estimated 18 to 20 million tonnes per year of Middle Eastern methanol supply.42 In a globally traded market of roughly 55 million tonnes, this represents a catastrophic supply shock.42 Consequently, methanol futures in China have spiked significantly, and regional prices in the Middle East jumped by 7 percent in a single week during the early stages of the conflict.12

Alternative Capacity and Activation Timeframes

The immediate loss of Middle Eastern methanol exports forces global buyers to look toward established producers in the Americas and emerging green technology sectors in Asia and Europe.

  • The Americas and Oceania: Global producers like Methanex operate distributed networks with facilities in the United States, Canada, Trinidad, Chile, and New Zealand.42 These facilities boast a combined capacity of over 10.4 million tonnes per year and produced 7.8 million tonnes in 2025.42 While these plants are currently operating, they will prioritize existing contract customers and lack the immediate spare capacity to fully replace 20 million tonnes of stranded Middle Eastern product overnight.42 North America has been closing the gap between domestic supply and demand over the past decade due to cheap domestic shale gas, making it a more self sufficient market, but limited in its ability to rescue Asia.43
  • Green and Bio-Methanol Production: Over the medium to long term, the market is shifting toward bio-methanol and e-methanol to lower carbon emissions. The European Union’s Net Zero Industry Act and Renewable Energy Directive are accelerating adoption through funding and policy support.44 By 2030, Singapore aims to produce over 1 million metric tons of low carbon methanol.44 Furthermore, China is rapidly retrofitting infrastructure in provinces like Shanxi, targeting massive upgrades to methanol fuel stations by 2025.44

In the immediate 2026 timeframe, the methanol market will suffer severe rationing. Downstream manufacturers in Asia will be forced to draw down inventories rapidly. The high cost of alternative natural gas feedstocks globally will keep replacement methanol prices elevated until Middle Eastern shipping resumes, squeezing margins for manufacturers of plastics, paints, and automotive parts worldwide.

3.4. Urea and Nitrogen Based Fertilizers

The global agricultural sector is highly exposed to the Gulf conflict, creating severe food security risks. The Middle East accounts for approximately 35 percent of the global seaborne trade in urea, exporting roughly 18 to 20 million tonnes annually.22 Industrially, urea is produced through the reaction of ammonia and carbon dioxide under high pressure, heavily relying on natural gas availability.47 The disruption of natural gas supplies and the physical blockade of vessels have effectively choked off supply from major exporters like Saudi Arabia and Qatar.45

Within 48 hours of the initial military strikes, North African urea prices surged by nearly 20 percent.48 Southeast Asian spot prices spiked to $700 per tonne, and United States Gulf futures jumped to $500 per tonne on the commodities exchange.46 This price shock comes at a highly sensitive time, as the Northern Hemisphere enters its critical spring planting season.

Alternative Capacity and Activation Timeframes

The immediate burden of replacing Middle Eastern urea shifts to producers in Southeast Asia and North America, though the transition is fraught with logistical and pricing challenges.

  • Southeast Asia and Oceania: Countries heavily reliant on Middle Eastern urea, such as Australia and Thailand, are pivoting rapidly to regional neighbors. Australia imports approximately 64 percent of its urea from the Middle East, while Thailand relies heavily on Saudi Arabia.22 Producers in Malaysia, Brunei, and Vietnam are stepping in to fill the void. For example, Vietnam’s Ca Mau facility successfully diverted 40,000 tonnes of granular urea to Australia for April 2026 loading to support the impending fertilizer application season.46
  • North America: United States farmers entered the 2026 spring planting season with roughly 75 percent of their required fertilizer supplies already secured locally.49 However, because fertilizers are globally priced commodities, United States domestic prices will still rise in sympathy with global shortages, adding to the record high input costs for American agriculture.49
  • China: While China is a massive urea producer, a persistent global price premium could lead the Chinese government to delay exports to protect domestic agricultural stability, further tightening the global market.48

The capacity to pick up urea demand exists in Asia and the Americas, and transactions are occurring within a rapid timeframe via the spot market. However, the sheer volume of displaced Middle Eastern urea means alternative suppliers can only partially mitigate the shortfall. This will lead to sustained high input costs for global farmers throughout the 2026 growing seasons, potentially forcing crop switching and lowering overall yields.22

3.5. Sulphur and Phosphate Fertilizer Complexes

Sulphur is a vital raw material required for the production of phosphate fertilizers, specifically monoammonium phosphate and diammonium phosphate. The Mideast Gulf exercises profound dominance over this market, originating fully 50 percent of the global seaborne sulphur trade, which totals approximately 20 million tonnes annually.22 The region also directly accounts for 20 percent of global monoammonium phosphate and 14 percent of global diammonium phosphate exports, primarily loaded from Saudi Arabia’s Ras al-Khair port.22

The blockade has triggered immediate price shocks, with United States Gulf diammonium phosphate prices climbing to $655 per metric ton in the first week of the war.22 The disruption severely threatens fertilizer producers in India and Morocco, which rely heavily on Middle Eastern sulphur and ammonia to manufacture finished phosphates for the global export market.22

Alternative Capacity and Activation Timeframes

Replacing 50 percent of the world’s sulphur is structurally challenging, and the timeframe for securing alternatives is heavily constrained by industrial realities.

  • Global Industrial Alternatives: Alternative sourcing must rely on by product sulphur captured from oil and gas refining operations in North America, China, and Russia. However, redirecting these flows involves complex logistical realignments and cannot be accomplished overnight. The lack of idle global sulphur capacity means the supply shock will be immediate and severe.
  • Agricultural Adaptation and Crop Switching: The primary alternative in this sector is demand destruction and agricultural adaptation. If the conflict restricts supplies beyond a few weeks, farmers in the Southern Hemisphere and South Asia will alter planting decisions. Producers will likely shift away from input intensive crops like maize, wheat, and rice in favor of oilseeds such as soybeans, which require significantly less applied nitrogen and phosphate.22
  • Regional Food Security Corridors: For the Persian Gulf countries themselves, which are highly dependent on agricultural imports through the Strait of Hormuz, alternative overland routes are being established. Grain shipments are moving from Russia to Iran and from Turkey to Iraq, but these overland routes incur significantly higher costs compared to maritime bulk shipping.22
Fertilizer ComponentMiddle East Global Export SharePrimary Affected ImportersMarket Mitigation Strategy
Sulphur50 percentChina, Morocco, India, AfricaSourcing by product sulphur from global refining operations
Urea35 percentBrazil, India, Thailand, AustraliaSoutheast Asian spot market purchases (Vietnam, Malaysia)
Ammonia21 percentIndia, Morocco, South KoreaGlobal inventory drawdowns and delayed production
Diammonium Phosphate14 percentIndia (primarily Q3 demand)Reduced application rates and crop switching to oilseeds

The shock to the phosphate supply chain will manifest as lower global crop yields and heightened food insecurity in vulnerable import dependent nations.22 Energy costs associated with post farmgate expenses, such as milling and refrigeration, will further exacerbate global food inflation.22

3.6. Primary Aluminum Smelting and Manufacturing

Aluminum smelting is incredibly energy intensive, making the energy rich Middle East a key global producer. The region accounts for 8 to 9 percent of global primary aluminum production and serves as a vital swing supplier to Europe, the United States, and non China Asian markets.17 The war has devastated this sector in the short term. Following the cessation of liquefied natural gas supplies from QatarEnergy, the Qatalum smelter was forced into a controlled shutdown.17 Simultaneously, Aluminium Bahrain declared force majeure due to the inability to export finished metal or import raw alumina through the heavily contested Strait of Hormuz.17

This immediate collapse in supply sent London Metal Exchange aluminum prices surging to near four year highs of $3,499.50 per ton.51 United States consumers are exceptionally vulnerable to this shock. The Middle East previously supplied nearly a fifth of United States aluminum imports, and domestic buyers are already squeezed by historical import tariffs.19

Alternative Capacity and Activation Timeframes

The aluminum supply chain operates on strict just in time delivery models, meaning supply disruptions cause immediate factory chaos for automotive, appliance, and construction manufacturers.19

  • Asia and Australia Sourcing: United States buyers and manufacturers, such as Bonnell Aluminum and RM Metals, are urgently scrambling to secure alternative cargoes from markets in India and Australia.19 Procurement teams are forced to operate on accelerated timelines of days to secure metal before inventory runs dry.19
  • North American Domestic Market: Manufacturers may tap the domestic United States or Canadian markets for near term deliveries, provided there is uncontracted spot metal available outside of annual agreements.19 Canada remains the largest foreign supplier to the United States and serves as a critical buffer.19
  • Structural Timelines: The search for alternative supplies is occurring rapidly. However, because new aluminum smelting capacity takes years to build and requires massive energy infrastructure, the global market will remain in a severe deficit until Middle Eastern logistics normalize.52 Furthermore, rising global energy costs threaten to inflate production costs for smelters worldwide, compounding the pricing pressure and leading to potential demand destruction over the medium term.51

3.7. Iron Ore Pellets and Direct Reduced Iron Steel

The conflict has disrupted raw material flows vital to modern steelmaking across the Gulf. Iran and Bahrain collectively accounted for roughly 18 percent of global seaborne iron ore pellet exports in 2025.18 These pellets are specifically graded for use in direct reduced iron facilities. The outbreak of hostilities abruptly halted bulk carriers from entering the Gulf to supply these plants, with shipping data indicating zero bulk carriers loaded with iron ore entering the Gulf in early March.18 Several vessels bound for Gulf ports diverted away from the region, risking a collapse in regional steel production and weighing heavily on local construction activity.18

Alternative Capacity and Activation Timeframes

The global iron ore pellet supply base is geographically diverse, allowing for a somewhat structured realignment of trade flows, though quality specifications remain a critical constraint.

  • South America: Brazil remains a dominant force in high grade pellet exports, with major producers like Vale and Samarco holding significant capacity.53 Although Vale slightly adjusted its 2026 output guidance, Brazilian export volumes remain robust and capable of absorbing diverted global demand.54
  • Asia: India is actively expanding its footprint in the seaborne market. State owned NMDC Limited has initiated long term pellet sales from its Donimalai plant, and Indian export capacities are well positioned to serve Asian buyers pivoting away from Middle Eastern suppliers.55 China, India, and South Korea are expected to showcase promising growth in pellet sales.55
  • Eastern Europe: Despite regional conflicts, Ukraine’s Metinvest has demonstrated remarkable production resilience, allocating massive investments to scale pellet production and launching 11 new product types.55
  • Market Realignment Timeline: Iron ore trade flows will shift over the course of the 2026 fiscal quarters. Shippers are currently restructuring short term cargo offers to account for higher freight and insurance costs.56 Market participants anticipate that the convergence of Brazilian capacity scaling and Indian procurement expansion will stabilize the high grade pellet market by late 2026.55 Chinese mills, facing sluggish domestic property sector demand, are maintaining cautious inventory light models and prioritizing cost effective procurement channels.54

3.8. Air Freight Cargo Capacity and Global Logistics

The airspace restrictions and safety risks resulting from the intense missile exchanges have severely crippled the Middle East’s role as a global aviation transit hub. Key consolidation points, specifically Dubai, Abu Dhabi, and Doha, have seen operations vastly degraded with over 3,400 flights cancelled or diverted.20 In 2024, Dubai and Doha processed 2.2 million and 2.6 million tonnes of freight respectively, representing roughly two thirds of all Middle Eastern air cargo.58

The sudden restriction of these critical hubs removed an estimated 12 percent of global cargo capacity from the market overnight.59 This capacity shock occurred against a backdrop of already rising global demand, pushing dynamic load factors higher and driving air cargo spot rates up by 5 percent globally.59 Specific corridors felt the shock more acutely, with Europe to North America rates seeing 21 percent spikes, and the Northeast Asia to North America semiconductor corridor seeing rates grow by 10 percent.59

Alternative Capacity and Activation Timeframes

The logistics industry is highly agile, but rerouting global trade around a major continental hub incurs severe time and cost penalties.

  • Alternative Flight Routing: Carriers are forced to divert flights, adding intermediate stops and avoiding the airspace entirely.60 Freight forwarders are shifting volumes to the Transpacific corridor and utilizing direct Asia to Europe routes that bypass the Gulf entirely.57
  • Intermodal Solutions: Shippers are increasingly relying on sea air combinations via alternative regional ports, though these multimodal solutions add significant transit time and complexity.
  • Duration of Impact: The capacity crunch is immediate and will persist for the exact duration of the military conflict and airspace closures.20 The logistics market’s recovery is entirely dependent on the cessation of hostilities. Furthermore, rising jet fuel costs, which are directly tied to the crude oil price spikes caused by the Strait of Hormuz blockade, will further inflate air freight rates in the short to medium term, acting as a major cost component for all diverted flights.20

3.9. Water Desalination and Regional Security Infrastructure

Unlike globally traded commodities, the disruption to water desalination infrastructure presents an existential and strictly localized crisis for the Persian Gulf. The Gulf states, often referred to as saltwater kingdoms, rely on more than 400 desalination plants to provide drinking water for approximately 100 million people.61 In nations like Kuwait, Oman, and Saudi Arabia, energy intensive desalination accounts for 70 to 90 percent of the municipal water supply.62

Iran has explicitly targeted this critical infrastructure. Drone strikes have caused material damage to a water desalination plant in Bahrain, marking the first time a Gulf nation reported targeting of such a facility during the conflict.63 Additionally, Iranian projectiles have landed dangerously close to Dubai’s massive Jebel Ali complex, which produces over 160 billion gallons of water a year.61 Furthermore, because many desalination plants are physically integrated with local power grids via combined heat and power systems, attacks on general energy infrastructure pose severe cascading risks to water production.64

Alternative Capacity and Activation Timeframes

The water security crisis in the Gulf is unique because it cannot be solved through international trade or global supply chain realignment.

  • Lack of Viable Alternatives: There are no external regions that can supply municipal water to the Middle East at the required scale. Alternatives such as mobile desalination units or imported bottled water tankers are logistically incapable of sustaining populations of millions.61
  • Timeframe to Crisis: The timeframe for this shock is measured in days, not months. Defense analysts warn that if major plants are knocked offline, entire cities could deplete their drinking water reserves within 48 to 72 hours.65
  • Security Mobilization: To mitigate this existential threat, regional governments are urgently attempting to hire private foreign military specialists, radar operators, and electronic warfare technicians to bolster the layered defense of these facilities.15 Private military corporations are seeing increased demand for ground security teams and system specialists to provide protection during active operations.15

3.10. Defense Industrial Base and Munitions Manufacturing

The unprecedented intensity of Operation Epic Fury has placed massive strain on the United States defense industrial base. The air campaign requires an extraordinary expenditure of precision guided munitions and interceptors to systematically dismantle Iranian ballistic capabilities and defend regional assets.8 The operation is estimated to cost nearly $900 million per day, driven heavily by munition consumption.68 Key assets being depleted rapidly include Joint Direct Attack Munitions, Tomahawk cruise missiles, AIM-9X air to air missiles, and Patriot PAC-3 MSE interceptors.66

The United States military was already firing interceptors in the Red Sea at rates faster than they could be manufactured prior to the Iran conflict.70 The current war has exposed structural bottlenecks in the American defense supply chain that cannot be resolved quickly by merely increasing budget allocations or utilizing the Defense Production Act.

Alternative Capacity and Activation Timeframes

The capacity to pick up this manufacturing demand relies entirely on domestic and allied defense contractors, but the supply chain is highly constrained by industrial physics.

  • Industrial Bottlenecks and Specialty Chemistry: Final assembly of missiles is rarely the binding constraint. The production of solid rocket motors is limited by a narrow slice of specialty chemistry.70 Specifically, the supply of ammonium perchlorate, a critical oxidizer, is consolidated into very few vulnerable domestic production nodes.70 Curing times for rocket propellants and strict qualification regimes for energetic materials cannot be safely rushed.70
  • Rare Earth Mineral Dependence: Advanced missiles require rare earth minerals like neodymium and samarium for guidance systems, and tungsten for kinetic penetrators.70 The processing of these critical minerals is heavily dominated by China, creating a severe strategic vulnerability for the United States defense supply chain.70
  • Production Surges and Investment: The defense sector, led by primes like Lockheed Martin, RTX, and L3Harris, is attempting to surge output, treating the conflict as a primary growth engine.71 The Pentagon has executed massive direct investments into rocket motor businesses to secure propulsion supplies.70
  • Activation Timeframe: Replenishment timelines are measured in years, not months. For context, prior to the surge, Patriot PAC-3 MSE missiles were produced at a rate of only 600 to 650 annually.69 The defense industrial base will require a multi year mobilization stretching through 2027 and 2030 to replace the massive inventories expended in the 2026 conflict.70
Critical munition replenishment bottlenecks: ammonium perchlorate, neodymium, tungsten. Years timeframe.

4. Geopolitical Responses and Regional Defense Postures

The 2026 Iranian Gulf War has catalyzed a profound shift in regional defense postures and diplomatic alignments. Foreign affairs analysts note that the scale of the Iranian retaliation forced an unprecedented all of government response across the Gulf Cooperation Council.72 For the first time in history, all Gulf Cooperation Council states were targeted by the same actor within a 24 hour period, realizing a long standing strategic nightmare for regional planners.72

The performance of regional integrated air and missile defense networks has been a critical variable in mitigating the conflict’s economic fallout. A years long effort to boost United States and Gulf security cooperation has yielded positive tactical results. The United Arab Emirates reported intercepting 175 of 189 detected ballistic missiles and 876 of 941 detected drones, representing interception rates exceeding 92 percent.13 Qatar similarly reported intercepting 98 of 101 ballistic missiles, and Bahrain successfully destroyed dozens of incoming projectiles.14

However, the national security analysis reveals a critical vulnerability regarding sustainability. While the interception rates are high, the cost asymmetry heavily favors Iran. Iran relies on comparatively cheap drones and legacy ballistic missiles, whereas the Gulf states expend highly sophisticated, multi million dollar interceptors.13 Gulf nations, including the United Arab Emirates and Qatar, have already urgently requested the United States to help replenish their dwindling interceptor stockpiles.13

Diplomatically, the conflict is accelerating the fragmentation of the global order. Russia faces a strategic dilemma regarding its partnership with Iran. While Russia is not operationally dependent on Iran for its war in Ukraine, Moscow is actively sharing intelligence to support Iranian strikes against United States forces, seeking to tie down American military resources in the Middle East.8 Conversely, China finds itself trapped by the closure of the Strait of Hormuz, a waterway through which 45 percent of its imported oil and gas passes.9 Beijing is reportedly highly displeased with Tehran’s blockade and is actively engaging in direct negotiations with Iranian officials to secure safe passage exemptions for Chinese flagged tankers.9 However, maritime tracking data indicates that despite these diplomatic efforts, Chinese vessels remain largely frozen in the Gulf alongside Western shipping, exposing the limits of Beijing’s leverage over Tehran during an active survival crisis.7

5. Strategic Conclusions and Long Term Outlook

The 2026 Iranian Gulf War has demonstrated with absolute clarity that the global economy remains dangerously exposed to single point logistical failures. While the immediate focus of Operation Epic Fury has been the kinetic degradation of Iranian military and proxy capabilities, the second order effects have triggered a systemic reorganization of global supply chains.

The aggregated economic and energy sector data indicates that while energy markets have robust structural plans to increase capacity in the Americas, these additions are staggered over years. They cannot instantly replace the 20 million barrels of oil and massive volumes of gas trapped behind the Strait of Hormuz. Consequently, the global economy faces unavoidable short term inflationary pressures and heightened volatility in energy pricing through the remainder of 2026.

More critically, the conflict has highlighted severe vulnerabilities in less visible, yet equally vital, supply chains. The Middle East’s outsized role in the export of agricultural inputs poses a direct threat to global food security. A prolonged blockade will force structural changes in global agriculture, heavily impacting crop yields in import dependent regions across the Global South. Simultaneously, the rapid depletion of precision guided munitions has exposed the fragility of the United States defense industrial base, revealing deep dependencies on fragile chemical supply chains and foreign processed rare earth elements.

Ultimately, the geoeconomic legacy of this conflict will be a forced acceleration away from optimized, single source globalism. Governments and multinational corporations are now heavily incentivized to prioritize redundancy, invest massively in alternative geographic hubs across the Americas and Asia, and subsidize domestic manufacturing for critical materials, regardless of the immediate financial costs. The era of assuming uninterrupted access to the Persian Gulf has decisively ended.


Please share the link on Facebook, Forums, with colleagues, etc. Your support is much appreciated and if you have any feedback, please email us in**@*********ps.com. If you’d like to request a report or order a reprint, please click here for the corresponding page to open in new tab.


Works cited

  1. 2026 Iran conflict | Explained, United States, Israel, Map, & War | Britannica, accessed March 9, 2026, https://www.britannica.com/event/2026-Iran-Conflict
  2. Peace Through Strength: President Trump Launches Operation Epic Fury to Crush Iranian Regime, End Nuclear Threat – The White House, accessed March 9, 2026, https://www.whitehouse.gov/articles/2026/03/peace-through-strength-president-trump-launches-operation-epic-fury-to-crush-iranian-regime-end-nuclear-threat/
  3. Middle East Special Issue: March 2026, accessed March 9, 2026, https://acleddata.com/update/middle-east-special-issue-march-2026
  4. How Gulf States are responding to Iran’s retaliatory strikes, accessed March 9, 2026, https://www.washingtonexaminer.com/news/world/4476568/gulf-states-qatar-saudi-arabia-kuwait-bahrain-uae-responding-iran-retaliatory-strikes/
  5. Iran has largely halted oil and gas exports through strait of Hormuz – The Guardian, accessed March 9, 2026, https://www.theguardian.com/world/2026/mar/03/iran-has-largely-halted-oil-and-gas-exports-through-strait-of-hormuz
  6. March 8, 2026: Iran War Maritime Intelligence Daily – Windward, accessed March 9, 2026, https://windward.ai/blog/march-8-maritime-intelligence-daily/
  7. No One, Not Even Beijing, Is Getting Through the Strait of Hormuz, accessed March 9, 2026, https://www.csis.org/analysis/no-one-not-even-beijing-getting-through-strait-hormuz
  8. Iran Update Evening Special Report, March 6, 2026, accessed March 9, 2026, https://understandingwar.org/research/middle-east/iran-update-evening-special-report-march-6-2026/
  9. China Seeks Iran Deal for Tanker Passage Through Closed Strait of Hormuz, accessed March 9, 2026, https://chinaglobalsouth.com/2026/03/09/china-iran-strait-of-hormuz-oil-shipments/
  10. 2026 Iran war – Wikipedia, accessed March 9, 2026, https://en.wikipedia.org/wiki/2026_Iran_war
  11. The Energy Shock: U.S.-Israel War with Iran’s Impact on Indian …, accessed March 9, 2026, https://newlinesinstitute.org/middle-east-center/the-energy-shock-u-s-israel-war-with-irans-impact-on-indian-chinese-and-global-economies/
  12. ChemAnalyst Digest: How Iran War Affects Chemical Prices Globally, Should You be Worried?, accessed March 9, 2026, https://www.chemanalyst.com/NewsAndDeals/NewsDetails/chemanalyst-digest-how-iran-war-affects-chemical-prices-41348
  13. War Comes to the Gulf | The Washington Institute, accessed March 9, 2026, https://www.washingtoninstitute.org/policy-analysis/war-comes-gulf
  14. Iran’s drone and missile attacks on Gulf countries in numbers, accessed March 9, 2026, https://english.alarabiya.net/News/gulf/2026/03/04/iran-s-drone-and-missile-attacks-on-gulf-countries-in-numbers-
  15. Gulf states turn to private foreign military specialists amid Iran attacks, accessed March 9, 2026, https://www.middleeasteye.net/news/gulf-states-turn-private-foreign-military-specialists-amid-iran-attacks
  16. Commercial and Supply Chain Implications of the Gulf Conflict …, accessed March 9, 2026, https://www.gibsondunn.com/commercial-and-supply-chain-implications-of-the-gulf-conflict-shipping-contracts-and-insurance/
  17. The Middle East conflict and its impact on global metals markets, accessed March 9, 2026, https://www.argusmedia.com/en/news-and-insights/market-opinion-and-analysis-blog/middle-east-conflict-impact-global-metals-markets
  18. Middle East war disrupts dry bulk commodity trade as Hormuz shipping grinds to a halt, accessed March 9, 2026, https://www.kpler.com/blog/middle-east-war-disrupts-dry-bulk-commodity-trade-as-hormuz-shipping-grinds-to-a-halt
  19. US aluminium buyers hunt for alternatives as Iran war upends global supply, accessed March 9, 2026, https://www.businesstimes.com.sg/companies-markets/energy-commodities/us-aluminium-buyers-hunt-alternatives-iran-war-upends-global-supply
  20. Iran conflict tests 2026 air cargo outlook – Supply Chain Dive, accessed March 9, 2026, https://www.supplychaindive.com/news/middle-east-conflict-tests-2026-air-cargo-outlook/814069/
  21. 2026 Strait of Hormuz crisis – Wikipedia, accessed March 9, 2026, https://en.wikipedia.org/wiki/2026_Strait_of_Hormuz_crisis
  22. The Iran war: Potential food security impacts | IFPRI, accessed March 9, 2026, https://www.ifpri.org/blog/the-iran-war-potential-food-security-impacts/
  23. 2026 Outlook Energy Sector – Gabelli, accessed March 9, 2026, https://gabelli.com/research/2026-outlook-energy-sector/
  24. Petroleum liquids supply growth driven by non-OPEC+ countries in 2025 and 2026 – U.S. Energy Information Administration (EIA), accessed March 9, 2026, https://www.eia.gov/todayinenergy/detail.php?id=64565
  25. EIA forecasts U.S. crude oil production will decrease slightly in 2026 – U.S. Energy Information Administration (EIA), accessed March 9, 2026, https://www.eia.gov/todayinenergy/detail.php?id=66844
  26. United States Crude Oil Production – Trading Economics, accessed March 9, 2026, https://tradingeconomics.com/united-states/crude-oil-production
  27. Canadian Production Set for 3.5% Increase in 2026: Possible Pipeline Constraints Loom – A Plainview on Crude Oil, accessed March 9, 2026, https://www.plainview-energy.com/p/plainview-weekly-canadian-production
  28. Brazil, Guyana, and Argentina support forecast crude oil growth in 2026 – U.S. Energy Information Administration (EIA), accessed March 9, 2026, https://www.eia.gov/todayinenergy/detail.php?id=66884
  29. Venezuelan Oil Supply Crisis: Market Implications for 2026 – Fubex Lubricants, accessed March 9, 2026, https://fubex.net/blog/venezuelan-oil-supply-crisis-market-implications-for-2026/
  30. Breaking Down Venezuela’s Oil Outlook for the future – Aurora Energy Research, accessed March 9, 2026, https://auroraer.com/resources/aurora-insights/articles/breaking-down-venezuelas-oil-outlook-for-the-future
  31. EIA sees 2026 oil production decline despite regional growth, accessed March 9, 2026, https://energy-oil-gas.com/news/eia-sees-2026-oil-production-decline-despite-regional-growth/
  32. Gains, Risks and Regional Implications of US’ Iran War, accessed March 9, 2026, https://impakter.com/gains-risks-and-regional-implications-of-us-iran-war/
  33. U.S. LNG developers sign highest volume of sale and purchase contracts since 2022, accessed March 9, 2026, https://www.eia.gov/todayinenergy/detail.php?id=67264
  34. Energy Department Approves Export Expansion at Corpus Christi LNG, accessed March 9, 2026, https://www.energy.gov/articles/energy-department-approves-export-expansion-corpus-christi-lng
  35. Corpus Christi becomes second-largest US LNG export project thanks to export expansion approval, accessed March 9, 2026, https://www.offshore-energy.biz/corpus-christi-becomes-second-largest-us-lng-export-project-thanks-to-export-expansion-approval/
  36. Global LNG Capacity Tracker – Data Tools – IEA, accessed March 9, 2026, https://www.iea.org/data-and-statistics/data-tools/global-lng-capacity-tracker
  37. North America’s LNG export capacity could more than double by 2029 – U.S. Energy Information Administration (EIA), accessed March 9, 2026, https://www.eia.gov/todayinenergy/detail.php?id=66384
  38. US LNG Capacity Forecast to 2030 – Incorrys, accessed March 9, 2026, https://incorrys.com/liquefied-natural-gas-lng-forecast/north-american-lng-exports-to-2030/
  39. Iran Conflict Sets the LNG Markets on End: What Does This Mean for the Market, Investors, and Consumers?, accessed March 9, 2026, https://energynewsbeat.co/iran-conflict-sets-the-lng-markets-on-end-what-does-this-mean-for-the-market-investors-and-consumers/
  40. Innovation Outlook: Renewable Methanol, accessed March 9, 2026, https://methanol.org/wp-content/uploads/2020/04/IRENA_Innovation_Renewable_Methanol_2021.pdf
  41. Middle East Methanol Market Size | Industry Report, 2033, accessed March 9, 2026, https://www.grandviewresearch.com/industry-analysis/middle-east-methanol-market-report
  42. Methanex sees 18-20 million tonnes/year of Middle East methanol exports shut in – CEO, accessed March 9, 2026, https://www.icis.com/explore/resources/news/2026/03/06/11186452/methanex-sees-18-20-million-tonnes-year-of-middle-east-methanol-exports-shut-in-ceo
  43. Scaling Up Hydrogen: The Case for Low- Carbon Methanol – Bloomberg Professional Services, accessed March 9, 2026, https://assets.bbhub.io/media/sites/25/2024/06/BNEF-Methanol-Report_to-publish.pdf
  44. Green Methanol Market Growth, Forecast, and Industry Insights Report, accessed March 9, 2026, https://www.skyquestt.com/report/green-methanol-market
  45. Offers for urea derivatives evaporate, accessed March 9, 2026, https://www.argusmedia.com/news-and-insights/latest-market-news/2798316-offers-for-urea-derivatives-evaporate
  46. Urea derivatives surge on Middle East conflict | Latest Market News – Argus Media, accessed March 9, 2026, https://www.argusmedia.com/en/news-and-insights/latest-market-news/2794835-urea-derivatives-surge-on-middle-east-conflict
  47. Urea Market Size, Share & Growth Analysis | Report [2034] – Fortune Business Insights, accessed March 9, 2026, https://www.fortunebusinessinsights.com/urea-market-106850
  48. Global fertilizer markets feel impact of conflict in the Middle East – Rabobank, accessed March 9, 2026, https://www.rabobank.com/knowledge/q011517071-global-fertilizer-markets-feel-impact-of-conflict-in-the-middle-east
  49. Middle East Tensions Raise Spring Planting Concerns, accessed March 9, 2026, https://www.fb.org/market-intel/middle-east-tensions-raise-spring-planting-concerns
  50. Iran war to disrupt urea and sulphur supplies, accessed March 9, 2026, https://www.producer.com/crops/iran-war-to-disrupt-urea-and-sulphur-supplies/
  51. Aluminum Surges on Supply Fears Amidst Oil Shock, accessed March 9, 2026, https://www.whalesbook.com/news/English/commodities/Aluminum-Surges-on-Supply-Fears-Amidst-Oil-Shock/69ae37116431e3e2859c2784
  52. Conflict in the Middle East threatens aluminium and alumina trade flows – CRU Group, accessed March 9, 2026, https://www.crugroup.com/en/communities/thought-leadership/2026/Conflict-in-the-Middle-East-threatens-aluminium-and-alumina-trade-flows/
  53. Iron Ore Pellets Market Size, Share | Industry Report [2026-2034], accessed March 9, 2026, https://www.fortunebusinessinsights.com/iron-ore-pellets-market-113953
  54. A shift in iron ore trade flows, preferences across imported iron ore grades expected in 2026, accessed March 9, 2026, https://www.fastmarkets.com/insights/shift-iron-ore-trade-flows-across-imported-iron-ore-grades-expected/
  55. Iron Ore Pellets Market Size & Forecast 2026-2036 – Future Market Insights, accessed March 9, 2026, https://www.futuremarketinsights.com/reports/iron-ore-pellet-market
  56. Global iron ore exports soften in February 26 as Chinese buying slows – SteelOrbis, accessed March 9, 2026, https://www.steelorbis.com/steel-news/latest-news/global-iron-ore-exports-soften-in-february-26-as-chinese-buying-slows-1440147.htm
  57. Air Freight Market Update – DHL Global Forwarding – United States of America, accessed March 9, 2026, https://www.dhl.com/us-en/home/global-forwarding/latest-news-and-webinars/air-freight-market-update.html
  58. GCC Air Freight Transport Market – Size, Share & Industry Trends Analysis, accessed March 9, 2026, https://www.mordorintelligence.com/industry-reports/gcc-air-freight-transport-market
  59. Middle East conflict clouds air cargo outlook despite demand rise – STAT Times, accessed March 9, 2026, https://www.stattimes.com/air-cargo/middle-east-conflict-clouds-air-cargo-outlook-despite-demand-rise-1358298
  60. Global Outlook for Air Transport Trade, AI, and the energy transition – IATA, accessed March 9, 2026, https://www.iata.org/en/iata-repository/publications/economic-reports/global-outlook-for-air-transport-december-2025/
  61. Iran Threatens Gulf Water Lifeline, accessed March 9, 2026, https://impakter.com/iran-threatens-gulf-water-lifeline/
  62. Oil built the Persian Gulf. Desalinated water keeps it alive. War could threaten both – Florida Politics, accessed March 9, 2026, https://floridapolitics.com/archives/783951-oil-built-the-persian-gulf-desalinated-water-keeps-it-alive-war-could-threaten-both/
  63. How targeting of desalination plants could disrupt water supply in the Gulf – Al Jazeera, accessed March 9, 2026, https://www.aljazeera.com/amp/news/2026/3/8/how-targeting-of-desalination-plants-could-disrupt-water-supply-in-the-gulf
  64. US-Iran conflict targets desalination, fueling Middle East water crisis fears – CHOSUNBIZ, accessed March 9, 2026, https://biz.chosun.com/en/en-international/2026/03/09/ZGN5DVLHPVCTTEWWZNDNHYCNEE/
  65. Oil built the Persian Gulf. Desalinated water keeps it alive. War could threaten both, accessed March 9, 2026, https://apnews.com/article/iran-war-desalination-water-oil-middle-east-12b23f2fa26ed5c4a10f80c4077e61ce
  66. FPRI Experts React | Understanding the Third Gulf War, accessed March 9, 2026, https://www.fpri.org/article/2026/03/fpri-experts-react-understanding-the-third-gulf-war/
  67. Why Iran’s ballistic missile launches are declining, accessed March 9, 2026, https://www.fdd.org/analysis/2026/03/04/why-irans-ballistic-missile-launches-are-declining/
  68. Latest Analysis: War with Iran | CSIS, accessed March 9, 2026, https://www.csis.org/programs/latest-analysis-war-iran
  69. Trump rallies defense titans to surge weapons output as Iran War rages, accessed March 9, 2026, https://wfin.com/fox-political-news/trump-rallies-defense-titans-to-surge-weapons-output-as-iran-war-rages/
  70. How Chemistry and Rocket Motors Constrain American Warfighting …, accessed March 9, 2026, https://nationalinterest.org/blog/buzz/how-chemistry-and-rocket-motors-constrain-american-warfighting
  71. User, accessed March 9, 2026, http://markets.chroniclejournal.com/chroniclejournal/article/marketminute-2026-3-9-war-footing-us-defense-stocks-break-out-as-west-asia-conflict-reaches-fever-pitch
  72. ‘Nightmare scenario’ for GCC countries, region as Iran unloads drones and missiles, accessed March 9, 2026, https://breakingdefense.com/2026/03/iran-attacks-uae-saudi-missiles-drones-gcc-air-defense/
  73. The Iran war exposes the limits of Russia’s leverage in a …, accessed March 9, 2026, https://www.chathamhouse.org/2026/03/iran-war-exposes-limits-russias-leverage-fragmenting-regional-order