Category Archives: History and Socio-Political Analytics

Topics relating to historical events, philosophies of governments, etc.

Navigating the U.S. Fiscal Crisis of 2026: Why the U.S. Can’t Just Print More Money

As of January 2026, the United States stands at a precipitous fiscal crossroads, facing a convergence of economic pressures that threaten the fundamental stability of the nation’s currency and its standing in the global order. The national debt has surpassed $38 trillion, a figure that now exceeds the total annual economic output of the nation, with a debt-to-GDP ratio approaching 120%.1 For the first time in American history, the federal government’s annual expenditure on net interest payments has eclipsed the budget for national defense, signaling a structural shift in the nation’s financial priorities from investment and security to debt service.3 This milestone is not merely symbolic; it represents a mathematical inflection point where the cost of past consumption begins to cannibalize the future capacity of the state to function.

The recent enactment of the “One Big Beautiful Bill Act” (OBBBA) in mid-2025 has further accelerated these trends, introducing permanent tax reductions without commensurate spending offsets, thereby widening the deficit to nearly $1.8 trillion annually.5 While politically expedient, these measures have exacerbated the structural imbalance between revenues and outlays, forcing the Treasury to issue debt at a pace that global markets are increasingly hesitant to absorb.

This report serves as a comprehensive advisory on the mechanics of money supply, the dangers of unconstrained fiscal expansion, and the long-term economic perils of “printing money” (monetization) as a remedy for sovereign debt. Contrary to the seductive simplicity of Modern Monetary Theory (MMT) or the political convenience of quantitative easing, the fundamental laws of economics remain immutable: money is a store of value, not a creator of wealth. An artificial expansion of the money supply, decoupled from productivity growth, inevitably results in the devaluation of the currency.

The evidence is mounting. Inflation, having proved stickier than the “transitory” narratives of the early 2020s, remains elevated at 2.7% as of December 2025, buoyed by tariff-induced price pressures and resilient demand.7 Simultaneously, a quiet but profound shift is occurring in the global financial architecture; in 2025, for the first time in decades, the value of gold held by foreign central banks surpassed their holdings of U.S. Treasuries.9 This “de-dollarization” trend represents a vote of no confidence in the long-term purchasing power of the dollar and the fiscal discipline of the United States government.

To preserve the standard of living for the American citizenry and maintain the United States’ geopolitical leverage, the federal government must reject the siren song of monetization. Instead, it must undertake the arduous but necessary work of restoring fiscal balance through spending control and structural reform. This report details the economic principles underlying these conclusions, offering a sober analysis of why the printing press is an instrument of ruin, not salvation.

The Precipice of 2026: A Fiscal State of the Union

The fiscal landscape of early 2026 is defined by a series of unprecedented milestones that suggest the United States economy has entered a new and precarious phase of its history. The era of “easy money”—characterized by near-zero interest rates and low inflation—has decisively ended, replaced by a regime of high debt service costs, persistent inflationary pressure, and growing skepticism from international creditors.

The New Arithmetic of Debt

As of January 7, 2026, the total gross national debt of the United States stands at approximately $38.43 trillion.10 To contextualize this figure, it represents an increase of $2.25 trillion in a single year, averaging a daily accumulation of over $8 billion.10 This acceleration is not the result of a singular crisis, such as a war or a pandemic, but rather the outcome of structural profligacy. The debt per household has reached $285,127, a burden that is effectively a silent mortgage on the future earnings of every American family.10

The composition of this debt has also shifted. In previous decades, deficits were often financed by domestic savings or the reliable recycling of trade surpluses from nations like China and Japan. However, in 2026, the demand dynamics have inverted. Foreign central banks, once the most voracious consumers of U.S. debt, have become net sellers, forcing the domestic market and the Federal Reserve to absorb a larger share of issuance.

The One Big Beautiful Bill Act (OBBBA) and Structural Deficits

The legislative centerpiece of 2025, the “One Big Beautiful Bill Act” (OBBBA), has fundamentally altered the trajectory of federal revenues. Signed into law on July 4, 2025, the OBBBA introduced a suite of populist tax cuts designed to alleviate the cost-of-living crisis for specific demographics.5 Key provisions include:

  • Senior Deduction: An additional $6,000 standard deduction for individuals over age 65, aimed at protecting retirees from inflation.5
  • Overtime Tax Exemption: A deduction for overtime pay, theoretically designed to incentivize labor participation but practically reducing the income tax base.11
  • Car Loan Interest Deduction: Allowing the deduction of interest on vehicle loans, a policy that encourages debt-fueled consumption in the auto sector.5

While these measures provided immediate political relief, their fiscal impact has been corrosive. The Congressional Budget Office (CBO) projects that the cumulative effect of the OBBBA will be a 29 percentage point increase in the debt-to-GDP ratio over the next three decades.1 By permanently reducing the tax base without addressing the primary drivers of mandatory spending—Social Security and Medicare—the government has locked in a structural deficit that persists even during periods of economic expansion.

The deficit for Fiscal Year 2025 reached $1.8 trillion, and projections for FY 2026 suggest no abatement.6 This creates a “fiscal dominance” scenario where the government’s need for financing overrides all other economic considerations, including the central bank’s mandate to control inflation.

The Nature of Money: A Primer on Value and Trust

To understand why the government cannot simply print $38 trillion to retire its debt, one must first strip away the complexities of modern finance and examine the fundamental nature of money itself. In the public imagination, money is often conflated with wealth. If an individual has more dollars, they are wealthier; therefore, it seems intuitive that if the nation had more dollars, the nation would be wealthier. This is a dangerous fallacy known as the “money illusion”.13

Money as a Measuring Stick

Money is not wealth. Wealth consists of real assets: fertile land, factories, technological infrastructure, skilled labor, energy resources, and finished goods. Money is merely the measuring stick used to value these assets and the medium of exchange used to trade them. It is a claim check on society’s production.

If the government prints more claim checks without increasing the production of goods and services, the value of each individual claim check must mathematically decline. This is not a policy choice; it is an arithmetic certainty derived from the laws of supply and demand.

The Equation of Exchange

Economists utilize the Equation of Exchange to describe the mechanical relationship between the money supply and the price level. This equation serves as the cornerstone for understanding inflation.

M x V = P x Q

Where:

  • M (Money Supply): The total amount of currency in circulation.
  • V (Velocity of Money): The frequency with which the average unit of currency is spent on new goods and services over a given period.
  • P (Price Level): The average price of goods and services in the economy.
  • Q (Real Output): The total quantity of goods and services produced (Real GDP).

In this equation, both sides must always be equal. The total amount of money spent (M x V) must equal the total value of goods sold (P x Q).

If the government increases the money supply (M) significantly to pay its debts, one of two things must happen to balance the equation:

  1. Real Output (Q) increases: The economy produces more goods to soak up the extra cash.
  2. Price Level (P) increases: Prices rise to reflect the abundance of cash relative to goods.

In a mature, industrialized economy like the United States in 2026, Real Output (Q) grows relatively slowly—typically 2-3% per year. Therefore, if the money supply (M) is expanded by 20% or 30% to finance a deficit, output cannot possibly keep pace. The result is that the Price Level (P) must rise. This is the definition of inflation: too much money chasing too few goods.14

The “Island Economy” Analogy

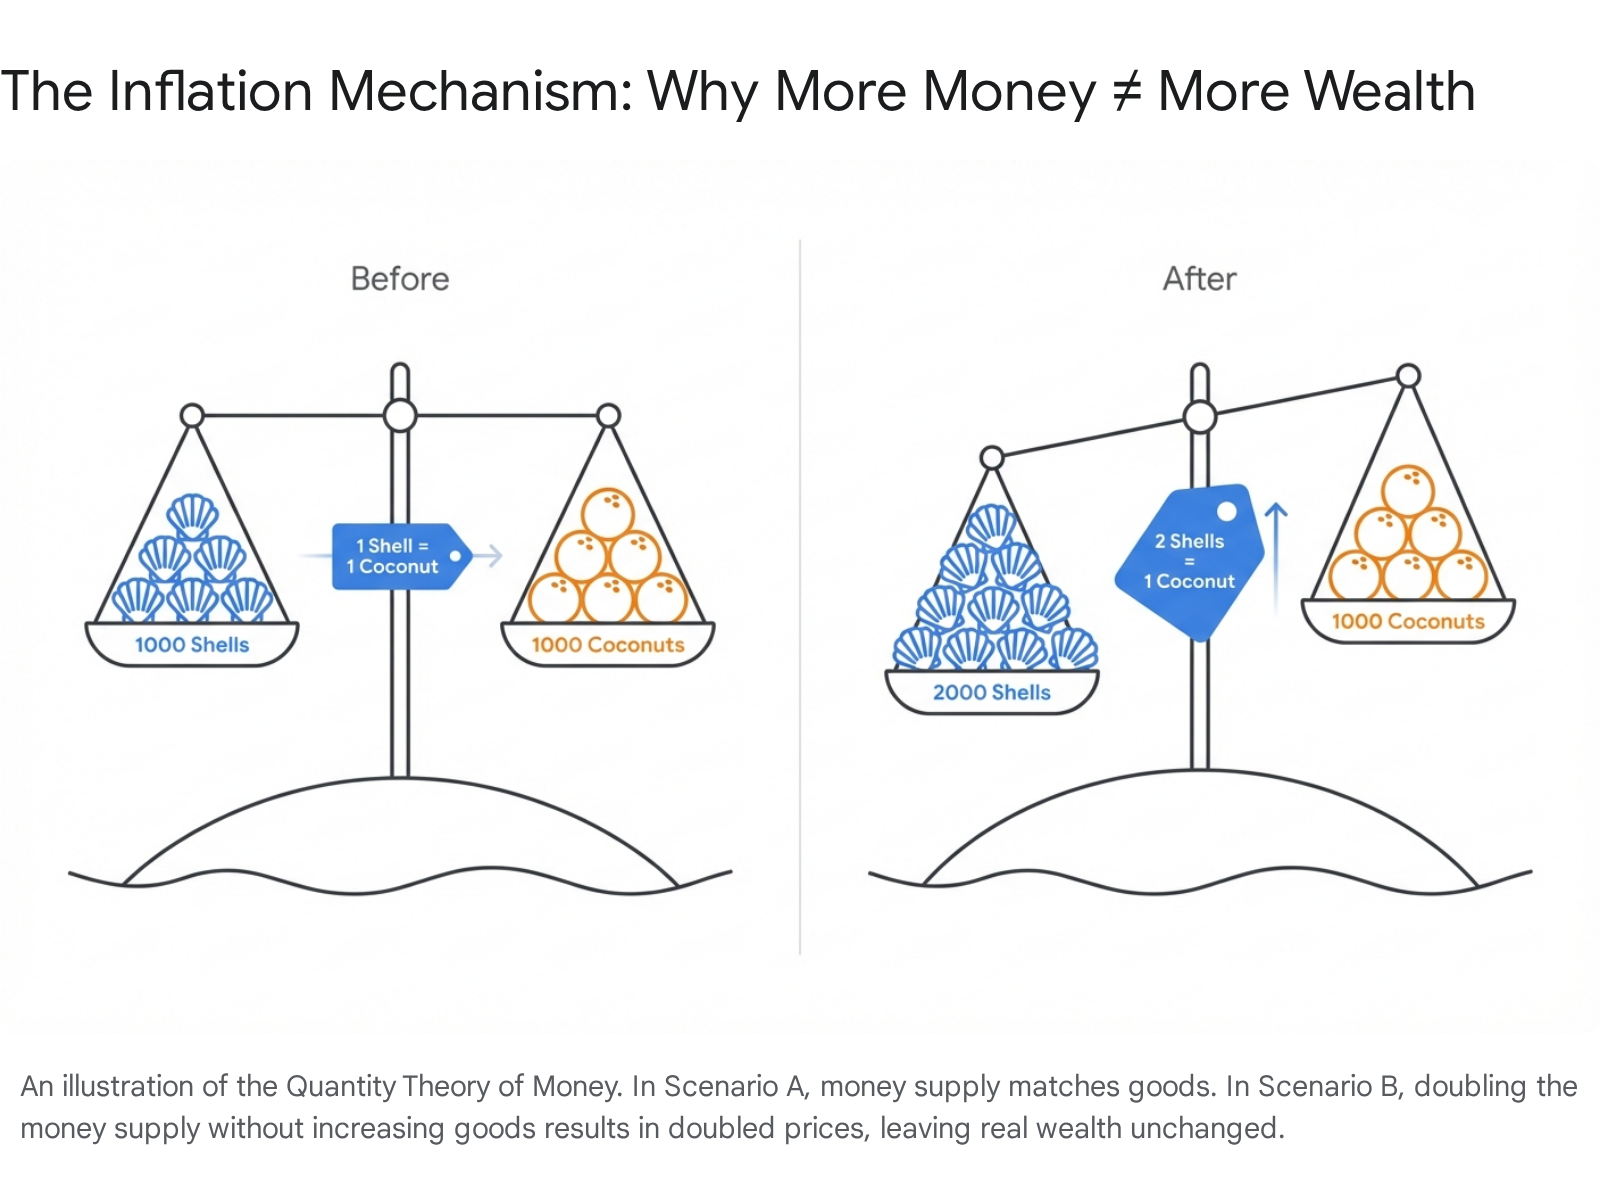
To visualize this, consider an isolated island economy that produces exactly 1,000 coconuts per year. The islanders use seashells as currency, and there are 1,000 shells in circulation. In this equilibrium, the price of one coconut is one shell.

Now, suppose the island chief discovers a hidden cave containing 1,000 new shells and distributes them equally among the villagers. The villagers feel momentarily rich—their nominal wealth has doubled. They rush to the market to buy more coconuts. However, the island still only produces 1,000 coconuts. There are now 2,000 shells chasing 1,000 coconuts. The price of a coconut will inevitably rise to two shells.

The villagers have twice as much money, but they can buy exactly the same amount of food. No new wealth was created; the currency was simply devalued. The government’s attempt to solve a resource constraint by printing money is equivalent to the chief trying to feed the village by printing more meal tickets. It does not create more food; it only makes the tickets worth less.

The Mechanism of Monetization and the Federal Reserve

The process by which the U.S. government “prints money” is often misunderstood. It is not as simple as the Treasury Department turning on a printing press. The process involves a complex interaction between the Treasury and the Federal Reserve, a process known technically as “debt monetization.”

Financing vs. Monetizing: A Critical Distinction

Under normal circumstances, when the U.S. government spends more than it taxes, it finances the deficit by borrowing. The Treasury issues bonds (Treasuries) and sells them to private investors, pension funds, and foreign governments. In this scenario, existing money is transferred from the private sector to the government. The total supply of money in the economy remains relatively stable; it merely changes hands. This is sustainable as long as there are willing buyers for U.S. debt at reasonable interest rates.

Monetization occurs when there are insufficient private buyers for the government’s debt, or when interest rates rise so high that the government cannot afford to pay them. In this scenario, the Federal Reserve steps in as the “buyer of last resort.” The Fed purchases the Treasury bonds using money that it creates instantly (digital reserves).15

  1. The Treasury issues debt.
  2. The Federal Reserve buys the debt.
  3. The Fed pays with newly created digital dollars.
  4. These new dollars enter the banking system and eventually flow into the broader economy.

This process is functionally equivalent to printing money. It expands the monetary base (M) without a corresponding increase in production (Q).

The Danger of Quantitative Easing (QE) Becoming Permanent

Following the 2008 financial crisis and the 2020 pandemic, the Federal Reserve engaged in Quantitative Easing (QE), purchasing trillions of dollars in bonds to stabilize markets. Proponents argued this would not cause inflation because the velocity of money (V) was collapsing during those crises.16 The new money largely sat in bank reserves rather than circulating in the economy.

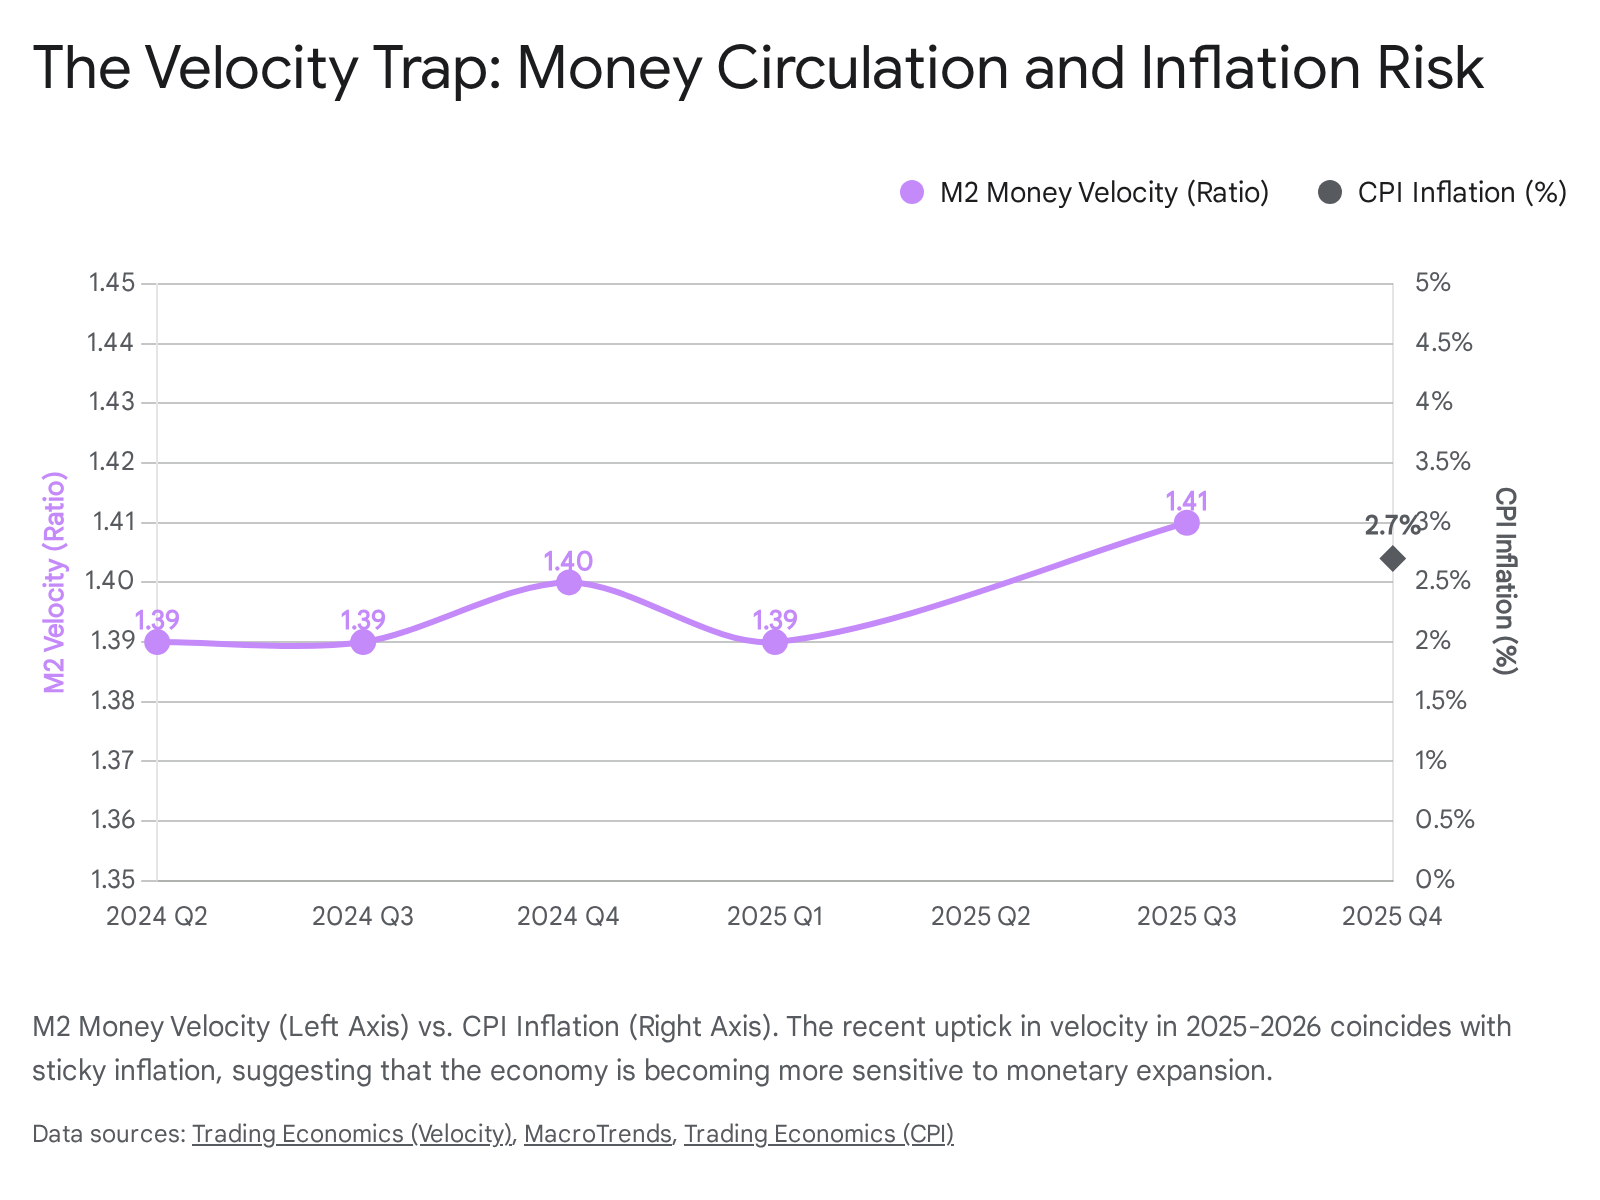
However, the situation in 2026 is fundamentally different. The economy is not in a deflationary collapse; it is facing supply constraints and sticky inflation. The velocity of money has stabilized and is beginning to tick upward.17 If the Federal Reserve were to resume large-scale asset purchases (monetization) to fund the $1.8 trillion deficit, that money would not sit idle. It would flow into an economy already near capacity, acting as high-octane fuel for inflation.

Recent data confirms this risk. M2 money velocity, which hit historic lows in 2020, has recovered to 1.406 as of late 2025.17 This uptick indicates that each dollar creates more inflationary pressure today than it did five years ago. This “Velocity Trap” means the Federal Reserve has far less room to maneuver than it did during previous crises.

The Interest Burden: A Structural Crisis

The most immediate and tangible consequence of the national debt is the cost of servicing it. For decades, the United States benefited from a low-interest-rate environment that made borrowing virtually free. That era has abruptly ended, exposing the federal budget to the harsh reality of compound interest.

The $1 Trillion Milestone

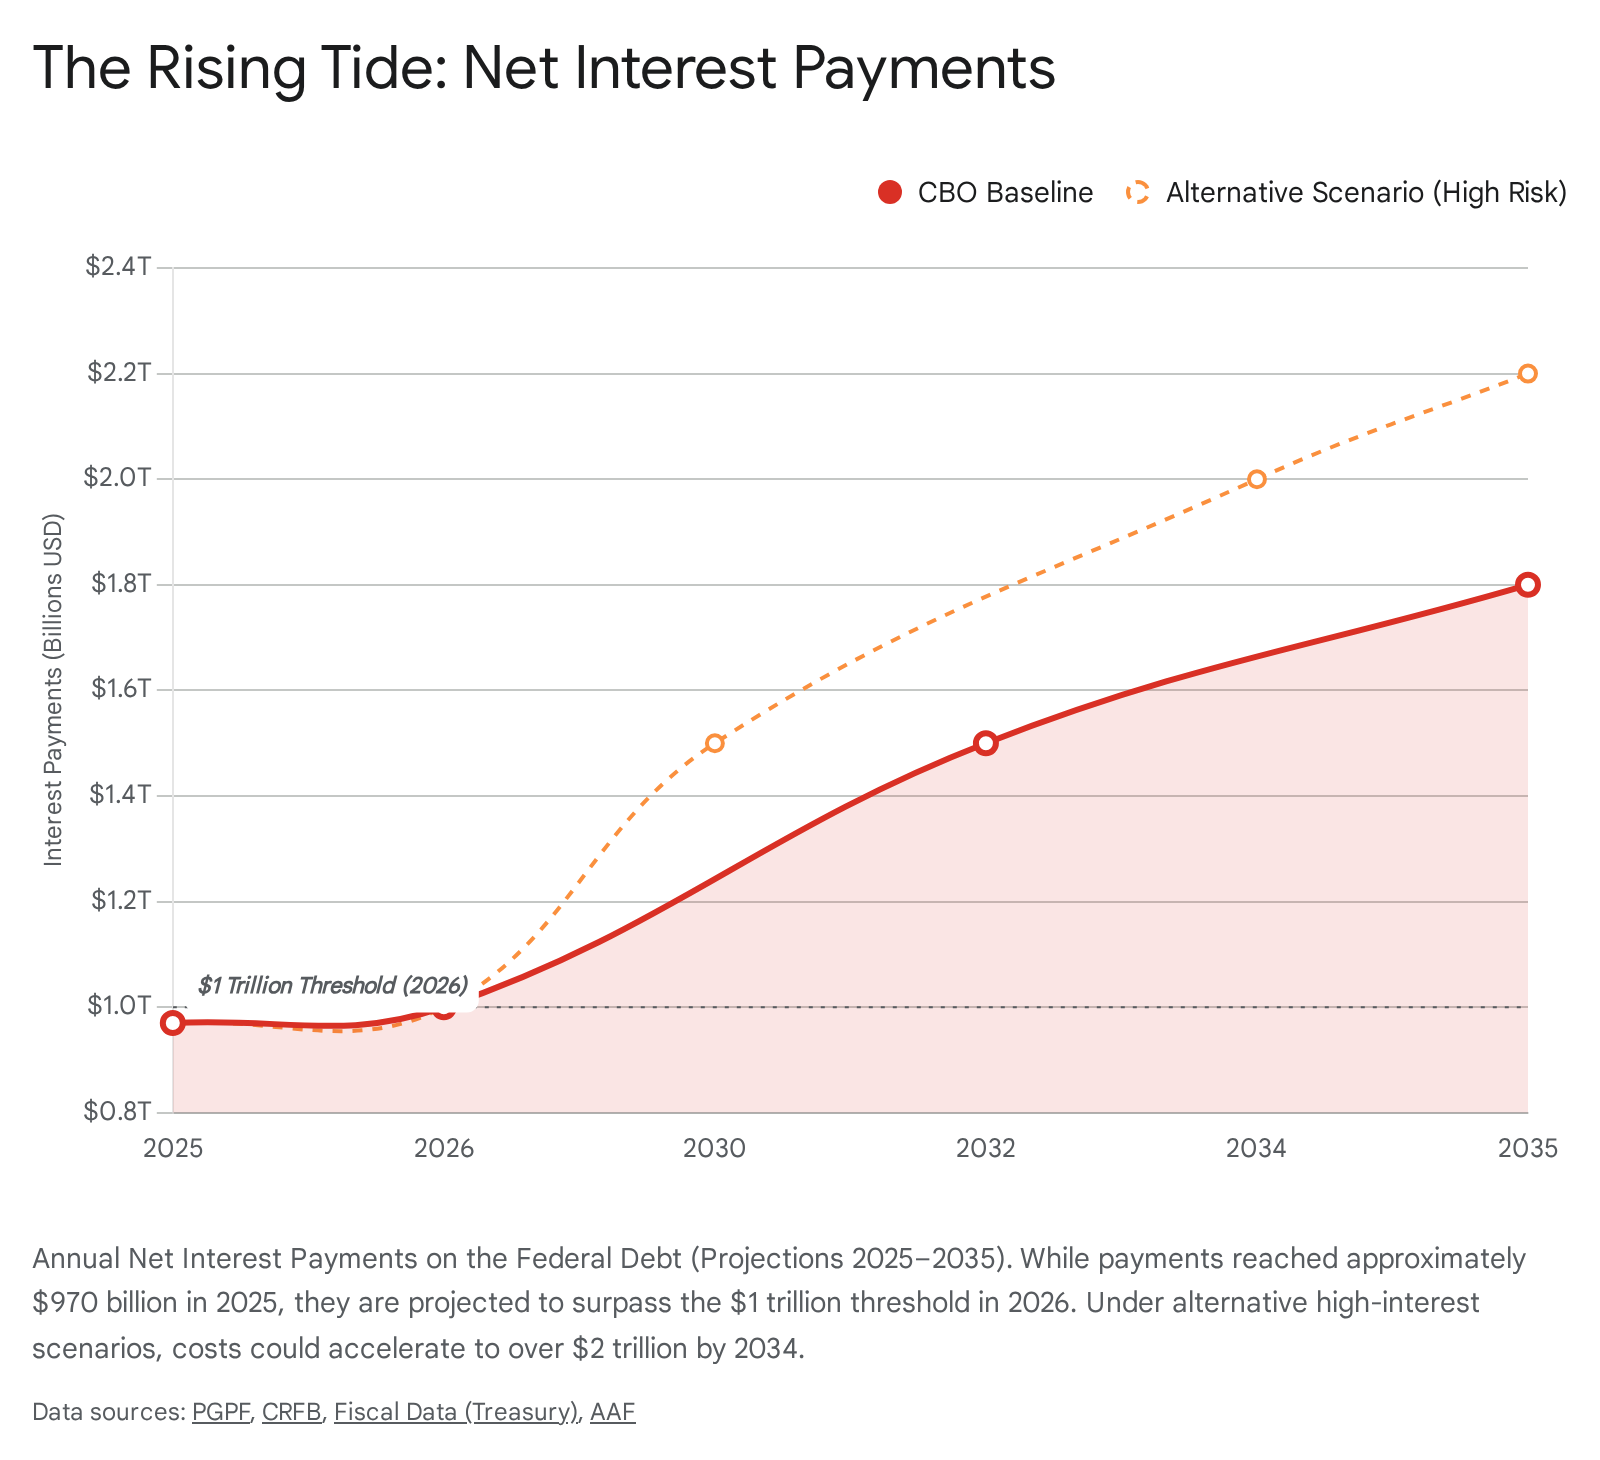
In Fiscal Year 2025, the federal government spent $970 billion on net interest payments.3 Projections for FY 2026 indicate that this figure will surpass $1 trillion for the first time in history.4

To grasp the magnitude of this expenditure, one must compare it to other national priorities. In 2026, the United States government will spend more on interest payments to bondholders than it spends on the entire Department of Defense. It will spend more on interest than on Medicaid. Interest payments have become the second-largest line item in the federal budget, trailing only Social Security.4

This represents a profound misallocation of national resources. Every dollar spent on interest is a dollar that cannot be spent on infrastructure, education, research, or tax relief. It is a retrospective payment for past consumption that yields no current economic benefit. This phenomenon is known as “crowding out,” where debt service squeezes all other discretionary spending out of the budget.

The Debt Spiral Mechanism

The rising interest burden creates a dangerous feedback loop known as a “debt spiral.” Because the government runs a primary deficit (spending more than revenue even before interest is paid), it must borrow money just to pay the interest on existing debt.

  1. The government borrows to pay interest.
  2. The total debt stock increases.
  3. Interest payments rise further due to the larger debt stock.
  4. The government must borrow even more the following year.

As of December 2025, the average interest rate on total marketable U.S. debt had risen to 3.362%, up from 1.552% just five years prior.20 If interest rates were to rise by just one additional percentage point, it would add hundreds of billions of dollars to the annual deficit, accelerating the spiral. This sensitivity to interest rates holds the federal budget hostage to bond market volatility.

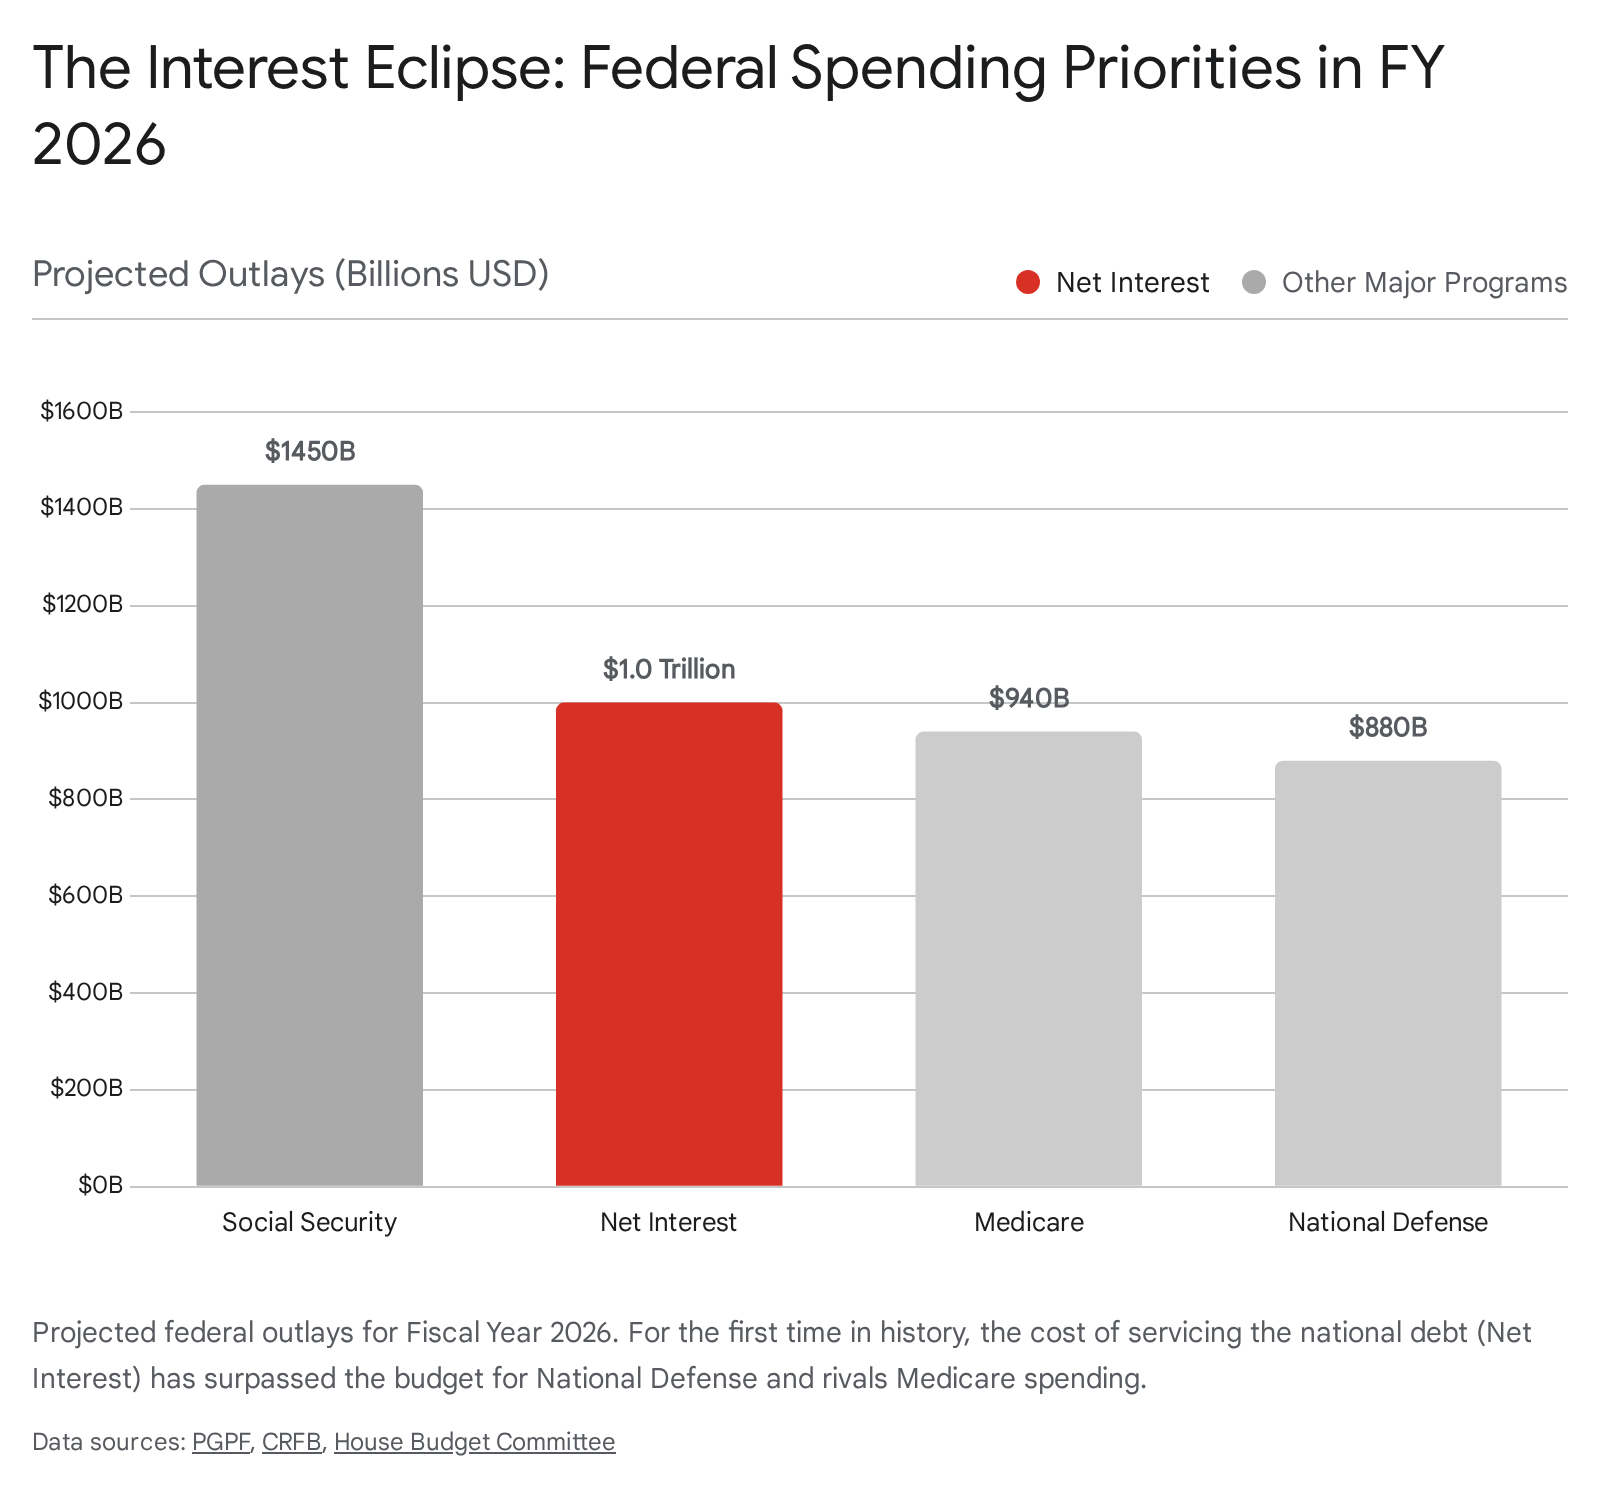
The visualization above highlights the stark reality of the 2026 budget. With interest payments consuming such a vast proportion of federal outlays, the government loses fiscal flexibility. In the event of a new recession, war, or pandemic, the fiscal capacity to respond is severely constrained by the existing obligations to bondholders.

The Global Dimension: De-Dollarization and the Erosion of Trust

The United States has long enjoyed a unique economic advantage known as the “exorbitant privilege.” Because the U.S. dollar serves as the world’s primary reserve currency, the U.S. can borrow money more cheaply and easily than any other nation. Global demand for dollars forces other countries to hold U.S. Treasury bonds as a safe asset. This allows the U.S. to run persistent trade deficits—importing goods and exporting dollars—without suffering an immediate currency collapse.

However, this privilege is contingent upon trust. Global investors must trust that the U.S. government will maintain the value of the dollar and honor its debts without resorting to inflation. In 2026, that trust is fracturing.

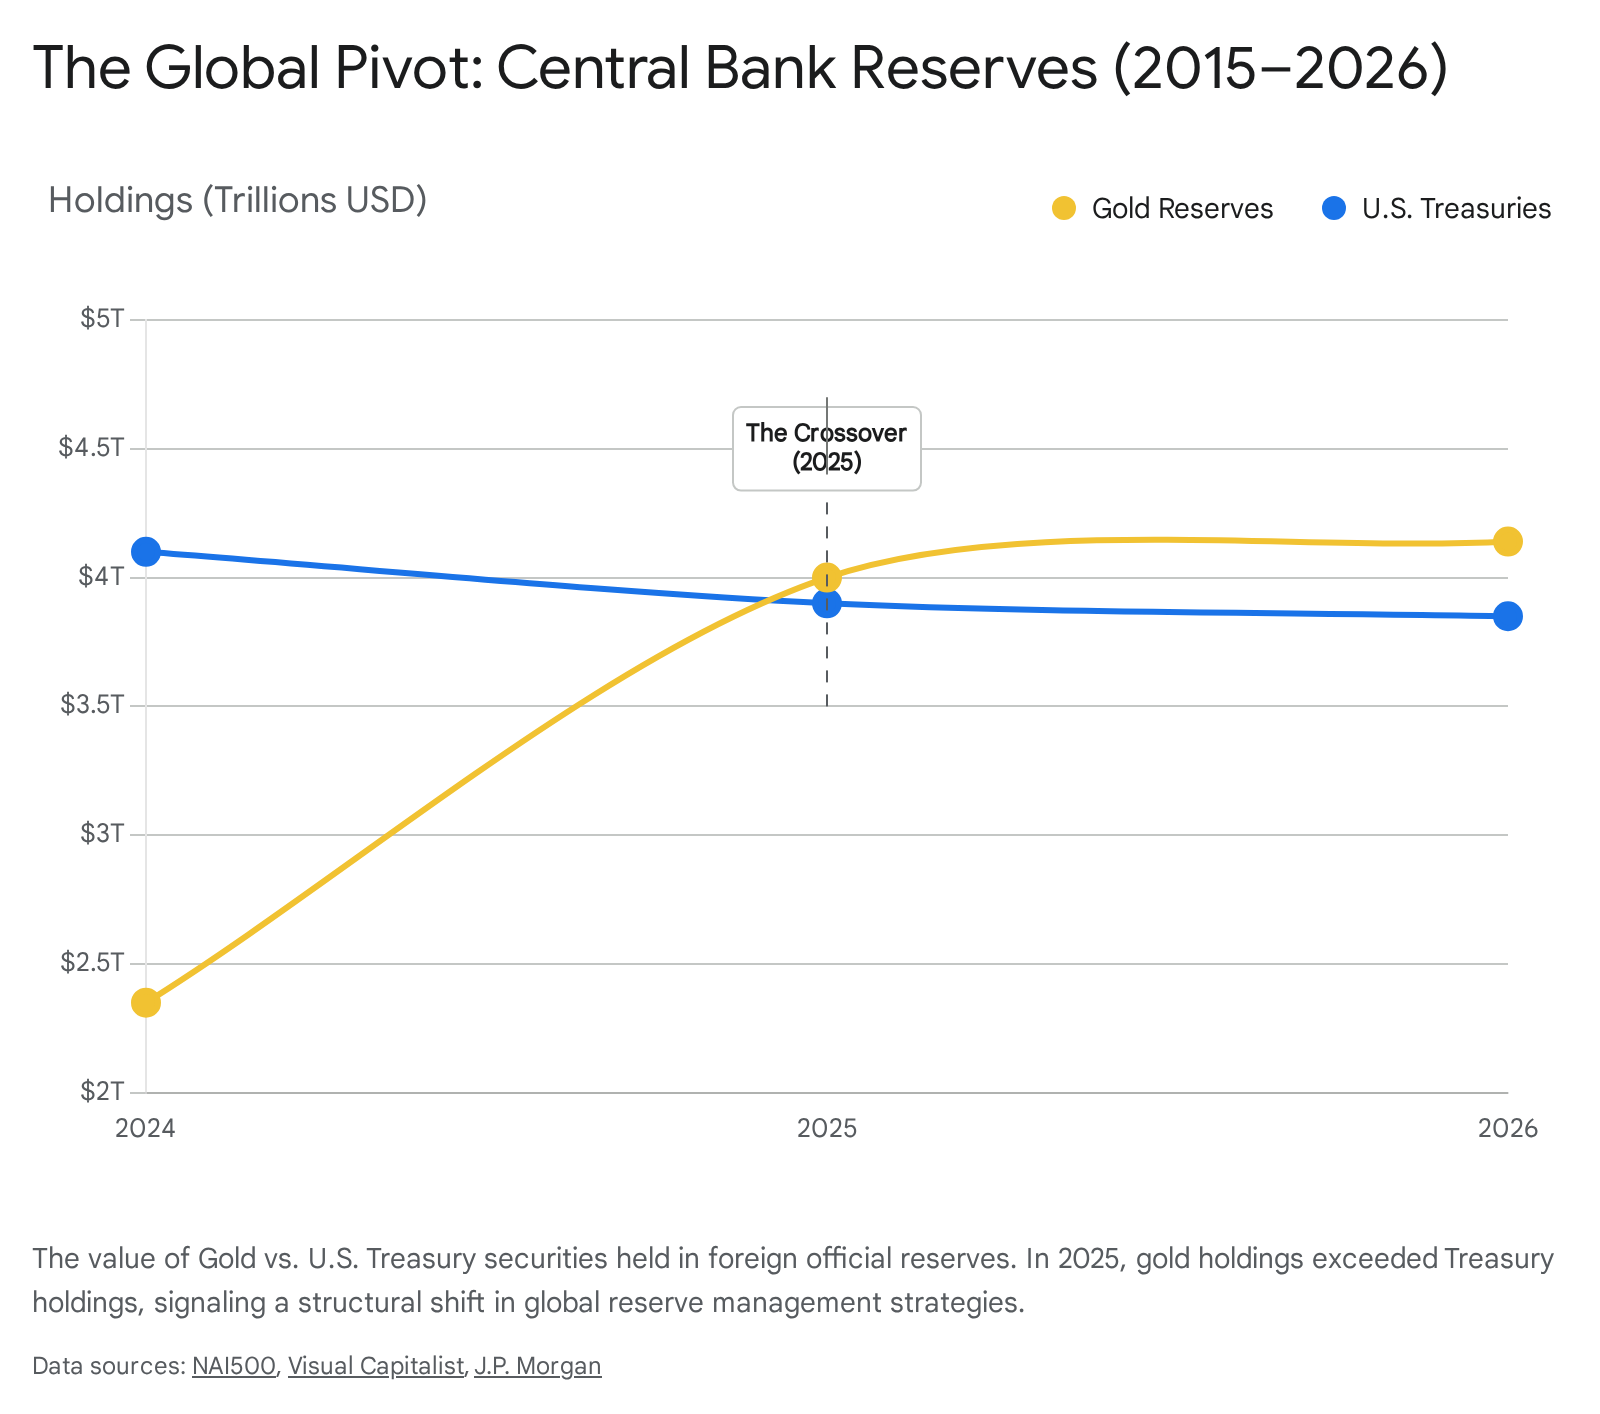
The Gold-Treasury Crossover of 2025

A watershed moment in international finance occurred in 2025: for the first time in nearly three decades, the value of gold held by foreign central banks surpassed their holdings of U.S. Treasuries.9

This is a geopolitical signal of the highest order. Central banks—the most conservative investors in the world—are actively diversifying away from the dollar. Nations such as China, India, and even historical allies are increasing their gold reserves while reducing or stagnating their exposure to U.S. debt.21 They are choosing a tangible, neutral asset (gold) over the financial promises of the United States government.

The drivers of this shift are twofold:

  1. Sanction Risk: The weaponization of the dollar financial system has demonstrated to foreign nations that dollar reserves can be frozen or seized. Gold, stored domestically, carries no such counterparty risk.
  2. Fiscal Skepticism: Foreign creditors are observing the U.S. fiscal trajectory—$38 trillion in debt and rising—and concluding that the only way the U.S. can pay its obligations is by devaluing the currency. They are exiting the market before that devaluation accelerates.

The Impact of De-Dollarization on the American Household

If the trend of de-dollarization continues, the consequences for the average American will be severe. A reduction in global demand for dollars leads to a depreciation of the currency’s exchange rate.

  • Imported Inflation: As the dollar weakens, the cost of imported goods rises. Everything from electronics and clothing to automobile parts and machinery becomes more expensive. This acts as a tax on American consumers, lowering their standard of living.23
  • Higher Interest Rates: If foreign central banks stop buying U.S. Treasuries, the U.S. government must offer higher interest rates to attract other buyers. This pushes up borrowing costs across the entire economy, making mortgages, car loans, and business credit more expensive.24
  • Loss of Purchasing Power: The “strong dollar” has allowed Americans to consume more than they produce for decades. A reversion to the mean would require a painful contraction in consumption.

The Specter of Inflation: Why “Sticky” is Dangerous

Inflation is often described as a tax that no one voted for. It transfers wealth from savers (who hold currency) to debtors (who pay back loans with devalued money). In 2026, the U.S. is grappling with “sticky” inflation—a rate that refuses to return to the 2% target despite the Federal Reserve’s efforts.

As of December 2025, the CPI stood at 2.7%, with core measures showing similar resistance.8 This is not the runaway inflation of the 1970s, but it is high enough to erode wages and destabilize planning.

The Tariff Factor

The current inflationary environment is complicated by trade policy. The tariffs maintained and expanded by the administration have raised the cost of imported goods.25 In a normal environment, these costs might be absorbed by corporate margins. However, in an environment of high demand and labor shortages, corporations are passing these costs directly to consumers.

The Risk of a Wage-Price Spiral

The most dangerous phase of inflation is when it becomes embedded in psychology. If workers expect prices to rise by 3% or 4% every year, they will demand commensurate wage increases. Corporations, facing higher labor costs, will raise prices further to protect margins. This feedback loop, known as a wage-price spiral, is incredibly difficult to break without causing a recession.

If the government were to resort to monetization (printing money) to solve its debt problem in this environment, it would pour gasoline on the fire. The public, sensing that the currency is being debased, would accelerate their spending to exchange rapidly depreciating dollars for tangible goods. This increase in the velocity of money would cause inflation to spike far beyond the proportional increase in the money supply.

Historical Case Studies: The Road to Ruin

The laws of economics are not suspended for great powers. History provides stark warnings of what happens when nations attempt to print their way out of debt.

Weimar Germany (1923)

Faced with crushing war reparations and a striking workforce in the Ruhr, the German government printed money to pay its bills. The result was one of the most famous hyperinflations in history. Prices doubled every few days. The middle class was wiped out as savings evaporated. The social chaos that ensued paved the way for political extremism and the ultimate destruction of the republic.26

Zimbabwe (2007-2008)

To fund patronage networks and cover the collapse of the agricultural sector, the Zimbabwean government printed money on an industrial scale. Inflation reached 79 billion percent per month. The currency became worthless litter in the streets, and the economy reverted to a primitive barter system. The lesson is that once confidence in a currency is lost, it is almost impossible to regain.26

Venezuela (2016-Present)

Despite sitting on the world’s largest oil reserves, Venezuela descended into economic ruin through a combination of mismanagement and monetization. The government printed money to fund social programs as oil revenues collapsed. The resulting hyperinflation destroyed the price system, leading to shortages of food and medicine and a massive refugee crisis.27

While the United States is a far more robust and diversified economy than these examples, the underlying principle remains: no nation can consume more than it produces forever by simply printing more claim checks.

The Path Forward: Solvency over Expediency

The United States faces a choice between two painful paths. The first is the path of least resistance: continuing to run massive deficits, monetizing the debt, and accepting a future of high inflation, currency devaluation, and diminished global standing. The second is the path of fiscal control.

Why We Must Balance the Budget

Balancing the budget is not an ideological fetish; it is a mathematical necessity for long-term stability.

  1. Stop the Debt Spiral: We must reach a “primary balance” where tax revenues cover all non-interest spending. This stops the debt from growing faster than the economy.
  2. Restore Trust: A credible plan to stabilize the debt would reassure global markets, lowering interest rates and reducing the cost of servicing the debt.
  3. Control Inflation: By reducing government borrowing, we reduce the aggregate demand pressure that drives inflation. This allows the Federal Reserve to normalize interest rates without crushing the economy.

Necessary Reforms

Achieving this will require difficult decisions that politicians have long avoided:

  • Entitlement Reform: The growth of Social Security and Medicare spending must be addressed through means-testing, retirement age adjustments, or efficiency improvements. These programs are the primary drivers of long-term debt.
  • Spending Restraint: The era of “emergency” spending for non-emergencies must end. Discretionary spending should be capped or reduced to pre-pandemic levels.
  • Revenue Adequacy: The tax code must be optimized to generate sufficient revenue to fund the government’s core functions. This may require revisiting the unfunded tax cuts of the OBBBA.

Conclusion

The printing press is a seductive illusion. It promises the ability to pay debts without sacrifice, to consume without producing, and to govern without choosing. But economics is the study of scarcity, and the printing press cannot create resources. It can only redistribute claims on existing resources, typically from the prudent to the profligate.

For the United States to remain a prosperous, stable, and sovereign nation, it must regain control of its checkbook. The sovereign solvency crisis of 2026 is a warning light that can no longer be ignored. We must choose the hard path of discipline today to ensure the survival of the American promise for tomorrow.


If you find this post useful, please share the link on Facebook, with your friends, etc. Your support is much appreciated and if you have any feedback, please email me at in**@*********ps.com. Please note that for links to other websites, we are only paid if there is an affiliate program such as Avantlink, Impact, Amazon and eBay and only if you purchase something. If you’d like to directly contribute towards our continued reporting, please visit our funding page.


Sources Used

  1. Projecting Federal Deficits and Debt, accessed January 13, 2026, https://www.nber.org/digest/202601/projecting-federal-deficits-and-debt
  2. Climbing US government debt casts a fiscal shadow – Deloitte, accessed January 13, 2026, https://www.deloitte.com/us/en/insights/topics/economy/spotlight/us-national-debt-fiscal-effects.html
  3. Interest Costs on the National Debt – Peterson Foundation, accessed January 13, 2026, https://www.pgpf.org/programs-and-projects/fiscal-policy/monthly-interest-tracker-national-debt/
  4. Trillion-Dollar Interest Payments Are the New Norm-2025-12-16, accessed January 13, 2026, https://www.crfb.org/blogs/trillion-dollar-interest-payments-are-new-norm
  5. One, Big, Beautiful Bill provisions | Internal Revenue Service, accessed January 13, 2026, https://www.irs.gov/newsroom/one-big-beautiful-bill-provisions
  6. CBO Estimates $1.8 Trillion Deficit for Fiscal Year 2025, accessed January 13, 2026, https://www.crfb.org/press-releases/cbo-estimates-18-trillion-deficit-fiscal-year-2025
  7. Inflation Nowcasting – Federal Reserve Bank of Cleveland, accessed January 13, 2026, https://www.clevelandfed.org/indicators-and-data/inflation-nowcasting
  8. United States Inflation Rate – Trading Economics, accessed January 13, 2026, https://tradingeconomics.com/united-states/inflation-cpi
  9. Gold Surpasses US Treasuries to Become World’s Largest Reserve Asset, accessed January 13, 2026, https://nai500.com/blog/2026/01/gold-surpasses-us-treasuries-to-become-worlds-largest-reserve-asset/
  10. National Debt Hits $38.43 Trillion, Increased $2.25 Trillion Year over Year, $8.03 Billion Per Day, accessed January 13, 2026, https://www.jec.senate.gov/public/index.cfm/republicans/2026/1/national-debt-hits-38-43-trillion-increased-2-25-trillion-year-over-year-8-03-billion-per-day
  11. One, Big, Beautiful Bill Act: Tax deductions for working Americans and seniors – IRS, accessed January 13, 2026, https://www.irs.gov/newsroom/one-big-beautiful-bill-act-tax-deductions-for-working-americans-and-seniors
  12. Monthly Budget Review: Summary for Fiscal Year 2025, accessed January 13, 2026, https://www.cbo.gov/publication/61307
  13. The Problem with Printing Money – Economics Help, accessed January 13, 2026, https://www.economicshelp.org/blog/634/economics/the-problem-with-printing-money/
  14. Why Does Printing More Money Make Everything More Expensive? – Reddit, accessed January 13, 2026, https://www.reddit.com/r/AskEconomics/comments/1ba3wki/why_does_printing_more_money_make_everything_more/
  15. Is QE monetizing the debt, and what does that even mean? | by Mark Woodworth – Medium, accessed January 13, 2026, https://medium.com/@markcwoodworth/is-qe-monetizing-the-debt-and-what-does-that-even-mean-2a6e9dd3b682
  16. Money and Inflation Explained: Feducation Video Series | St. Louis Fed, accessed January 13, 2026, https://www.stlouisfed.org/education/feducation-video-series/money-and-inflation-explained
  17. United States – Velocity of M2 Money Stock – 2026 Data 2027 Forecast 1959-2025 Historical, accessed January 13, 2026, https://tradingeconomics.com/united-states/velocity-of-m2-ratio-q-sa-fed-data.html
  18. Interest on the Debt to Grow Past $1 Trillion Next Year, accessed January 13, 2026, https://www.crfb.org/blogs/interest-debt-grow-past-1-trillion-next-year
  19. Deficit Tracker – Bipartisan Policy Center, accessed January 13, 2026, https://bipartisanpolicy.org/report/deficit-tracker/
  20. Debt Dashboard – U.S. Congress Joint Economic Committee, accessed January 13, 2026, https://www.jec.senate.gov/public/index.cfm/republicans/debt-dashboard
  21. Criminal probe at Federal Reserve to spur gold ETF demand, accessed January 13, 2026, https://www.etftrends.com/criminal-probe-federal-reserve-spur-gold-etf-demand/
  22. Gold overtakes U.S. Treasuries as the world’s largest foreign reserve asset in 2026 — can gold challenge the U.S. dollar’s dominance and hold its ground? – The Economic Times, accessed January 13, 2026, https://m.economictimes.com/news/international/us/gold-overtakes-u-s-treasuries-as-the-worlds-largest-foreign-reserve-asset-in-2026-can-gold-challenge-the-u-s-dollars-dominance-and-hold-its-ground/articleshow/126420128.cms
  23. De-dollarization: The end of dollar dominance? – J.P. Morgan, accessed January 13, 2026, https://www.jpmorgan.com/insights/global-research/currencies/de-dollarization
  24. How Could Federal Debt Affect You? – GAO.gov, accessed January 13, 2026, https://www.gao.gov/americas-fiscal-future/how-could-federal-debt-affect-you
  25. Trump Tariffs: Tracking the Economic Impact of the Trump Trade War – Tax Foundation, accessed January 13, 2026, https://taxfoundation.org/research/all/federal/trump-tariffs-trade-war/
  26. The Worst Cases Of Hyperinflation Of All Time – Retirable, accessed January 13, 2026, https://retirable.com/advice/lifestyle/worst-hyperinflation-all-time
  27. Venezuela’s Hyperinflation—Weimar or Zimbabwe on the Caribbean?, accessed January 13, 2026, https://nationalinterest.org/feature/venezuelas-hyperinflation-weimar-or-zimbabwe-caribbean-27487

Uncovering the 1979 Vela Incident: A Nuclear Test Revelation

On September 22, 1979, at 00:53:00 UTC, the orbital vigilance of the Cold War was pierced not by a Soviet salvo, but by a silent, distinct signature from the desolate waters of the South Indian Ocean. The United States Air Force satellite Vela 6911, an aging sentinel designed to monitor compliance with the 1963 Partial Test Ban Treaty (PTBT), registered a “double flash” of light. To the silicon bhangmeters onboard, the signal was unmistakable: the unique optical fingerprint of an atmospheric nuclear explosion. This event, designated Alert 747, did not trigger a war, but it did ignite a fierce internecine conflict within the United States government—a battle between empirical intelligence and political expediency that would define the latter half of the Carter Administration.1

The resulting controversy, known as the Vela Incident, stands as a seminal case study in the intersection of nuclear non-proliferation enforcement, diplomatic realism, and the politicization of scientific intelligence. For decades, the official narrative maintained ambiguity, suggesting the event was likely a meteoroid impact or a sensor glitch. However, an exhaustive review of declassified intelligence memoranda, scientific analyses, and historical archives suggests a different reality: a covert nuclear test conducted by Israel, likely with the logistical collaboration of apartheid South Africa. The incident reveals the fragility of international arms control regimes when their enforcement threatens broader geopolitical interests, specifically the ratification of the SALT II treaty and the preservation of Middle Eastern peace accords.2

Part I: The Architecture of Vigilance

The Origins of Project Vela

To understand the gravity of Alert 747, one must first appreciate the architecture of surveillance that detected it. The Vela program was born from the necessity of trust through verification. Following the Cuban Missile Crisis and the signing of the Limited Test Ban Treaty (LTBT) in 1963, the United States required a mechanism to monitor nuclear testing in the atmosphere, underwater, and in outer space.4 The treaty prohibited signatories from conducting nuclear explosions in these environments, driving the superpowers to underground testing. However, the fear of clandestine violations—particularly by emerging nuclear states or non-signatories—remained acute.

The Vela satellites were the first space-based observation devices jointly developed by the U.S. Air Force and the Atomic Energy Commission.4 While early generations focused on X-ray and gamma-ray detection, the “Advanced Vela” satellites (Vela 5 and 6 series) launched in the late 1960s were equipped with a crucial innovation: the “bhangmeter.”

The Bhangmeter and the Physics of Light

The bhangmeter was a silicon photodiode sensor designed to detect the specific optical signature of a nuclear fireball. Its name, derived whimsically from the Hindi word for cannabis (“bhang”), alluded to the idea that one would have to be intoxicated to believe such a sensor would work, yet it proved remarkably effective.5

The physics of an atmospheric nuclear explosion creates a unique temporal light signature known as the “double flash,” which the bhangmeters were calibrated to recognize:

  1. Pulse I (The Thermal Spike): Upon detonation, the nuclear device releases a massive burst of thermal X-rays. These X-rays are absorbed by the air immediately surrounding the device, heating it to incandescence and creating an intensely bright flash that lasts only a millisecond.
  2. The Minimum (Hydrodynamic Obscuration): As the fireball expands, a hydrodynamic shock front forms at its boundary. This shock wave compresses the air to such a density that it becomes opaque to visible light. This opaque shell effectively masks the glowing fireball inside, causing the detected luminosity to drop precipitously.
  3. Pulse II (Fireball Re-emergence): As the shock wave expands further, its temperature and density drop. Eventually, the shock front becomes transparent again (“breakaway”), revealing the fireball which is still expanding and radiating heat. This results in a second, much longer, and more massive pulse of light that builds to a maximum before decaying.2

This double-humped curve—bright flash, sudden dimming, and slow re-brightening—is the “heartbeat” of a nuclear explosion. Natural phenomena like lightning (a single spike) or meteoroids (an impact flash) do not replicate this specific hydrodynamic obscuration sequence. By 1979, Vela satellites had detected 41 previous double flashes. In every single case, the signal was subsequently confirmed as a nuclear test.1

The Sentinel: Vela 6911

The satellite that detected Alert 747, Vela 6911 (also known as Vela 5B), was launched on May 23, 1969.1 By September 1979, it was ten years old—seven years past its design lifetime of three years. Despite its age, the satellite’s sensors were functional and had successfully tracked French and Chinese atmospheric tests throughout the decade. On the night of September 22, it was orbiting at an altitude of approximately 67,000 miles, holding a field of view that encompassed a 3,000-mile diameter circle covering the southern tip of Africa, the Indian Ocean, the South Atlantic, and parts of Antarctica.1 It was a lonely vigil; other satellites in the constellation were either retired or not positioned to view the southern hemisphere at that specific moment, leaving Vela 6911 as the sole optical witness.

Part II: The Geopolitical Tinderbox (1977–1979)

The detection of a nuclear flash did not occur in a vacuum; it struck a world wired for tension. The Carter Administration was navigating a precarious diplomatic landscape where the non-proliferation regime was clashing with the strategic necessities of the Cold War.

The Stalled SALT II Treaty

By late 1979, the Strategic Arms Limitation Talks II (SALT II) treaty was the centerpiece of President Jimmy Carter’s foreign policy legacy. Signed in Vienna in June 1979 by Carter and Soviet General Secretary Leonid Brezhnev, the treaty aimed to limit the growth of nuclear arsenals. However, ratification required a two-thirds majority in the U.S. Senate, where it faced fierce skepticism.6

Hawkish senators, including John Glenn and Frank Church, were deeply concerned about the Soviet Union’s adherence to previous agreements and the ability of the U.S. to verify compliance.7 Senator Glenn, chair of the Subcommittee on Energy, Nuclear Proliferation and Federal Services, was particularly focused on verification technologies. If the administration admitted that an unknown actor could detonate a nuclear weapon without the U.S. being able to definitively identify the perpetrator or prove the violation, confidence in the verification regime—and by extension, SALT II—would collapse. The administration simply could not afford a “mystery” nuclear test.2

The Axis of Isolation: Israel and South Africa

While Washington focused on Moscow, a clandestine strategic alignment was solidifying in the Southern Hemisphere. Both Israel and South Africa faced deepening international isolation. South Africa, under the apartheid regime of P.W. Botha, was subject to a mandatory UN arms embargo (Resolution 418) adopted in 1977.2 Israel, though an American ally, found itself increasingly isolated following the 1973 Yom Kippur War and was acutely aware of its lack of strategic depth.

Intelligence declassified decades later indicates that this shared isolation bred a “survivalist” symbiosis. Documents reveal a 1975 secret defense agreement signed by Israeli Defense Minister Shimon Peres and South African Defense Minister P.W. Botha.9 This agreement facilitated military cooperation that likely extended to nuclear technology. South Africa possessed vast uranium reserves and open spaces for testing, specifically the Kalahari test site which had been prepared for a cold test in 1977 before being discovered by Soviet and U.S. satellites.11 Israel, in turn, possessed advanced weapons design capabilities and delivery systems, specifically the Jericho missile technology.13

By 1979, Israel faced a strategic dilemma. The development of the Jericho II missile required a warhead. Some analysts, including former nuclear weapons designer Thomas Reed, suggest that Israel needed to test a specific type of low-yield device, possibly a neutron bomb or a miniaturized tactical weapon, to ensure the viability of its deterrent.2 South Africa, seeking its own deterrent against what it perceived as a Soviet-backed “Total Onslaught” from neighboring states, was a willing partner.

Part III: The September Flash

The Event Timeline

At 00:53:00 UTC on September 22, 1979, the two bhangmeters on Vela 6911 triggered. The signal intensity indicated a low-yield explosion, estimated between 2 and 3 kilotons.15 This was small by Cold War standards—Hiroshima was 15 kilotons—but consistent with a tactical weapon or a fission trigger for a thermonuclear device.

The location was triangulated to a remote area of the South Indian Ocean, roughly situated between the Prince Edward Islands (South African territory) and the Crozet Islands (French territory).2 This region is known for the “Roaring Forties,” an area of persistent high winds and cloud cover, which would help scrub radioactive debris from the atmosphere and mask the visual signature from surface observers. Notably, the test coincided with a typhoon in the region, further suggesting a deliberate attempt to use weather as cover.2

The Immediate Reaction: “High Confidence”

In the days following the detection, the U.S. Intelligence Community (IC) mobilized. The initial assessment was unambiguous. The CIA, the Defense Intelligence Agency (DIA), and the Naval Research Laboratory (NRL) all assessed with high confidence that a nuclear event had occurred. A CIA memo from later that year estimated a “90% plus” probability of a nuclear test.16 The DIA’s Jack Varona argued that the signal was distinct and could not be explained by natural phenomena.11

President Carter was informed immediately. His diary entry from September 22, 1979, reads: “There was indication of a nuclear explosion in the region of South Africa—either South Africa, Israel using a ship at sea, or nothing.” This entry reveals that the President’s first instinct—and the first intelligence briefing he received—pointed directly at the most likely suspects.17

Part IV: The Triad of Evidence

While the Vela signal (Alert 747) was the primary trigger, it was not the sole data point. A forensic reconstruction of the timeline reveals a triad of corroborating evidence that the intelligence community recognized, even if it was publicly minimized.

1. Hydroacoustic Signatures

The most compelling corroboration came from the ocean depths. The U.S. Naval Research Laboratory (NRL) analyzed data from the Missile Impact Locating System (MILS) and other hydroacoustic sensors (underwater microphones) monitored by the Air Force Technical Applications Center (AFTAC). Sensors near Ascension Island and other classified locations detected a distinct acoustic signal originating from the vicinity of the Prince Edward Islands that matched the exact time of the Vela flash.11

Sound travels efficiently through the SOFAR channel in the ocean, allowing detection over thousands of miles. NRL Director Dr. Alan Berman later stated that the signal was “unique to nuclear shots in a maritime environment” and was the strongest hydroacoustic pulse he had ever seen from that region.16 The NRL’s internal report concluded that the hydroacoustic evidence strongly suggested a nuclear test had taken place. However, because the signal reflected off the Antarctic ice shelf or ocean floor features, there was some debate about the precise location of the surface burst, a gap that later skeptics would exploit.17

2. Ionospheric Disturbances

In Puerto Rico, the Arecibo Observatory detected an anomalous traveling ionospheric disturbance (TID) moving from southeast to northwest on the morning of September 22.2 Nuclear explosions generate a shockwave that propagates up into the ionosphere, creating ripples in electron density that can be detected by radar. The timing and vector of the disturbance detected at Arecibo were consistent with a shockwave originating in the South Atlantic/Indian Ocean basin at the time of the Vela flash. This provided a second physical medium (the upper atmosphere) corroborating the satellite (optical) and hydroacoustic (underwater) data.16

3. The Search for Debris (The “Missing” Smoking Gun)

The standard confirmation for any nuclear test is the detection of radioactive fallout. The U.S. Air Force immediately launched WC-135 sorties to sample the air in the southern hemisphere. These flights found no radioactive debris. The lack of immediate debris became the primary argument for the skeptics.21 However, the search was hampered by the immense size of the search area and the delay in deploying aircraft. A low-yield surface burst in the ocean would produce less fallout than a ground burst, and the typhoon conditions could have washed out particulates (rainout) before they reached the sampling altitude.

Crucially, it would be decades before the biological archive revealed what the planes missed. As discussed in Part VII, iodine-131 was eventually found in sheep thyroids in Australia, but this data was not fully integrated into the public narrative in 1979.22

Part V: The Crisis in Washington

The Intelligence Consensus vs. The Political Imperative

The internal assessment of the U.S. government in late 1979 was a study in cognitive dissonance. The operational level of intelligence—the scientists at Los Alamos, the analysts at the CIA, and the engineers at NRL—viewed the event as a confirmed test. A “mini-SCC” (Special Coordinating Committee) meeting on January 9, 1980, reviewed the data. Despite the consensus among technical agencies, the political leadership, represented by National Security Adviser Zbigniew Brzezinski and White House staffers, pushed for a verdict of uncertainty.16

The motivation was clear. If the President declared a nuclear violation:

  1. Sanctions: Under the 1977 Symington Amendment and Glenn Amendment, the U.S. would be legally obligated to impose draconian sanctions on the perpetrator. Sanctioning Israel would destroy the Camp David peace framework, the administration’s crowning diplomatic achievement. Sanctioning South Africa would derail delicate negotiations regarding the independence of Rhodesia (Zimbabwe) and Namibia, areas where the U.S. needed Pretoria’s cooperation.21
  2. SALT II Vulnerability: Admitting that the Vela satellites detected a test that the U.S. could not “prove” or attribute would hand ammunition to SALT II opponents. Senators like Frank Church would argue that if the U.S. couldn’t identify a test by a minor power, how could it verify Soviet compliance with complex missile limits?.2

The “Whitewash” Strategy

The White House response, led by Science Adviser Frank Press, shifted from investigation to containment. Press convened an ad hoc panel of non-government scientists to review the Vela data. This body, which became known as the Ruina Panel, was viewed with deep suspicion by the intelligence community. An internal memo from the time noted that the White House seemed only interested in hearing dissenting views “so that we can more safely ignore [the nuclear conclusion]”.16

This strategy effectively bifurcated the truth: there was the classified reality, where intelligence agencies operated on the assumption of a joint Israeli-South African test, and the public narrative, which aggressively promoted ambiguity and natural explanations.

Part VI: The Ruina Panel and the “Zoo Event” Theory

The Panel’s Mandate and Composition

The Ad Hoc Panel on the September 22 Event was chaired by Dr. Jack Ruina of MIT, a former head of ARPA. It included distinguished scientists such as Richard Garwin (IBM), Luis Alvarez (Nobel laureate), and Wolfgang Panofsky (Stanford).1 The panel was tasked with reviewing the data to determine if a nuclear explosion was the only possible explanation.

Critically, the panel was not an investigative body with its own data-gathering capabilities; it was a review board that assessed data provided to it. However, witnesses later claimed the panel was selective in what it weighed heavily. NRL Director Alan Berman felt the panel dismissed his hydroacoustic data because it didn’t fit their preferred narrative, describing their treatment of the evidence as “incomplete” and “ambiguous”.20

The Meteoroid Hypothesis

In July 1980, the Ruina Panel released its findings. It concluded that the signal was “probably not” a nuclear explosion. Instead, they proposed that the signal was likely an artifact of a “zoo event”—a term used to describe inexplicable sensor anomalies in the complex environment of space.

The specific mechanism they proposed was a micrometeoroid impact. The panel hypothesized that a small meteoroid had struck the satellite, ejecting a cloud of debris. This debris, they argued, could have reflected sunlight into the bhangmeters in a way that mimicked the double flash. They suggested that the first pulse was the impact itself, and the second pulse was the reflection off the expanding debris cloud.1

The Scientific Critique: “One in One Hundred Billion”

The “Zoo Event” conclusion was met with immediate and withering criticism from defense scientists who managed the satellite program.

  1. Statistical Improbability: Researchers at Mission Research Corporation calculated the probability of a meteoroid striking the satellite at the precise angle and velocity to create a false “double pulse” signature that perfectly matched the timing of a nuclear explosion. The odds were calculated to be less than one in one hundred billion.1
  2. Sensor Discrepancy: The Vela satellite had two bhangmeters. For a debris cloud to fool both sensors simultaneously and identically, the geometry of the impact would have to be miraculously precise. The Ruina panel argued that the signals were slightly different, supporting the debris theory, while the Los Alamos team argued the differences were within calibration tolerances for a nuclear event.23
  3. The “Previous 41” Argument: There had been 41 previous double flashes detected by Vela satellites. Every single one had been a confirmed nuclear test. There was no precedent for a “false positive” double flash of this quality.2

Despite these objections, the Ruina Panel’s report gave the Carter Administration exactly what it needed: a scientific stamp of “inconclusive.” This allowed the White House to state that “no corroborating evidence” existed, effectively closing the book on the incident for the public, even as the CIA continued to track the Israeli nuclear program with high concern.17

Part VII: The Smoking Gun (Forensic Re-evaluation)

The “ambiguity” constructed by the Ruina Panel has largely eroded in the decades since, dismantled by new scientific studies and declassified admissions.

The Australian Sheep Connection

The most significant post-Cold War forensic breakthrough came in 2018. Researchers Lars-Erik De Geer and Christopher Wright published a definitive study in the journal Science & Global Security. They revisited a forgotten dataset: the thyroids of sheep slaughtered in Melbourne, Australia, in late 1979.22

Sheep thyroids are excellent bio-accumulators of Iodine-131, a short-lived radioactive isotope (half-life of 8 days) that is a primary product of nuclear fission. Because Iodine-131 decays so quickly, its presence is a timestamp; it cannot be a remnant of old tests from the 1960s. The researchers found a spike in Iodine-131 in samples taken in November 1979. Using advanced meteorological modeling, they backtracked the wind patterns from Victoria, Australia. The models showed that air masses passing over the Prince Edward Islands on September 22 would have reached southeastern Australia just as the rain washed the fallout onto the grazing pastures.24

This finding provided the “smoking gun” that the Ruina Panel claimed was missing. The combination of the optical flash, the hydroacoustic signal, and the radionuclide trace creates a closed loop of evidence that is statistically impossible to attribute to natural causes.

The Israeli Neutron Bomb Theory

The question remains: what exactly was tested? Historical analysis suggests it was not a standard fission bomb. Thomas Reed, in his book The Nuclear Express, argues that the device was likely an Israeli neutron bomb (enhanced radiation weapon).2

A neutron bomb is designed to maximize lethal radiation while minimizing blast and heat. Such a device would produce a lower explosive yield (consistent with the 2-3 kiloton estimate) and a smaller hydroacoustic footprint, potentially explaining why the acoustic signal was debated. However, it would still emit the intense X-rays necessary to trigger the bhangmeters. Reed posits that the Israelis, aware of the Vela satellite’s orbit (information likely obtained through intelligence channels), timed the test for a gap in coverage, not realizing that the “retired” Vela 6911 was still listening. The test was further masked by conducting it during a typhoon, using the storm front to scavenge particulate fallout before it could spread globally—a strategy that largely worked, except for the traces found in Australian sheep.2

The South African “Salute”

The political dimension of the test has also clarified. Following the end of apartheid, information regarding South Africa’s nuclear program began to surface. In 1997, South African Deputy Foreign Minister Aziz Pahad was quoted in the Israeli newspaper Haaretz confirming the event was a “salute” by the apartheid regime’s nuclear program.2 While his office later issued a clarification stating he was repeating rumors, the statement aligns with the known timeline of the “Arniston” missile tests.

The CIA had long tracked the “Arniston” facility, where South Africa and Israel cooperated on the development of the Jericho II missile (a medium-range ballistic missile). A nuclear test in 1979 would fit perfectly with the development cycle of a warhead for this delivery system.27 The collaboration provided Israel with the testing ground it lacked and South Africa with the missile technology it coveted.

Part VIII: Conclusions and Lessons Learned

The Vela Incident of 1979 was not a mystery; it was a secret. The preponderance of evidence—optical, hydroacoustic, ionospheric, and radiological—points to a low-yield nuclear test conducted by Israel with South African logistical support. That the United States government chose to officially label it “inconclusive” offers profound lessons for the contemporary analyst.

1. The Limits of Technical Verification

The Vela incident demonstrated that technical verification is necessary but insufficient. The satellite worked. The hydrophones worked. The scientists analyzed the data correctly. Yet, the detection was effectively nullified by political will. Verification is not just a scientific challenge; it is a political one. If a government is determined to ignore a violation to preserve a broader strategic relationship or treaty (in this case, SALT II and the Camp David Accords), it can manufacture enough ambiguity to paralyze the enforcement mechanism.

2. The “Ostrich Strategy” in Non-Proliferation

The Carter Administration’s response illustrates a recurring theme in U.S. non-proliferation policy: the “Ostrich Strategy.” When faced with a violation by a strategic ally or in a context that threatens broader goals, administrations may choose to look away. This ambiguity preserves short-term diplomatic frameworks but erodes the long-term credibility of the non-proliferation regime. The failure to call out the 1979 test arguably emboldened other proliferators, signaling that the U.S. might prioritize geopolitical expediency over strict enforcement.

3. The Persistence of Nuclear Shadows

The incident highlights the long tail of nuclear secrecy. It took nearly forty years for open-source science (meteorology and independent radionuclide analysis) to catch up with the classified assessments of 1979. This lag suggests that other “unresolved” proliferation events may currently be hidden behind similar veils of political ambiguity.

4. The Danger of “Politicized Science”

The Ruina Panel stands as a cautionary tale of how scientific inquiry can be channeled to support a pre-determined political conclusion. By framing the mandate narrowly and selecting panelists who were skeptical of the initial intelligence, the White House was able to generate a “scientific” counter-narrative that neutralized the intelligence community’s consensus. For the analyst, this underscores the importance of distinguishing between raw technical data (which pointed to a bomb) and high-level policy reports (which pointed to a meteoroid).

In the final analysis, Vela 6911 did its job. It saw the flash. The failure was not in the silicon eyes of the satellite, but in the political will of the men who read the data.

Works cited

  1. The Vela Incident: Nuclear Test or Meteorite? – The National Security Archive, accessed December 24, 2025, https://nsarchive2.gwu.edu/NSAEBB/NSAEBB190/index.htm
  2. Vela incident – Wikipedia, accessed December 24, 2025, https://en.wikipedia.org/wiki/Vela_incident
  3. Israel’s 1979 Nuclear Test and the US Government’s Attempt to Cover It Up, accessed December 24, 2025, https://www.npolicy.org/article.php?aid=647&rid=4
  4. Bhangmeter – Wikipedia, accessed December 24, 2025, https://en.wikipedia.org/wiki/Bhangmeter
  5. The Case for an Israeli Nuclear Test – Nonproliferation Policy Education Center, accessed December 24, 2025, https://npolicy.org/wp-content/uploads/2021/06/Moving_Beyond_Pretense-Ch13_Weiss.pdf
  6. Strategic Arms Limitation Talks (SALT II) – U.S. Department of State, accessed December 24, 2025, https://2009-2017.state.gov/t/isn/5195.htm
  7. The SALT II Treaty. Part 2: hearings before the Committee on Foreign Relations, United States Senate, Ninety-sixth Congress, first session, on Ex. Y, 96-1 – Content Details – CHRG-96shrg48240Op2 – GovInfo, accessed December 24, 2025, https://www.govinfo.gov/app/details/CHRG-96shrg48240Op2/CHRG-96shrg48240Op2
  8. The SALT II Treaty. Part 4: hearings before the Committee on Foreign Relations, United States Senate, Ninety-sixth Congress, first session, on Ex. Y, 96-1 – Content Details – CHRG-96shrg48260Op4 – GovInfo, accessed December 24, 2025, https://www.govinfo.gov/app/details/CHRG-96shrg48260Op4/CHRG-96shrg48260Op4
  9. Israel–South Africa Agreement – Wikipedia, accessed December 24, 2025, https://en.wikipedia.org/wiki/Israel%E2%80%93South_Africa_Agreement
  10. Revealed: how Israel offered to sell South Africa nuclear weapons – The Guardian, accessed December 24, 2025, https://www.theguardian.com/world/2010/may/23/israel-south-africa-nuclear-weapons
  11. The Vela Incident: South Atlantic Mystery Flash in September 1979 Raised Questions about Nuclear Test | National Security Archive, accessed December 24, 2025, https://nsarchive.gwu.edu/briefing-book/nuclear-vault/2016-12-06/vela-incident-south-atlantic-mystery-flash-september-1979-raised-questions-about-nuclear-test
  12. The Discovery of South Africa’s Secret Nuclear Test Site, August 1977, accessed December 24, 2025, https://nsarchive.gwu.edu/briefing-book/nuclear-vault/2023-10-26/discovery-south-africas-secret-nuclear-test-site-august-1977
  13. South Africa and weapons of mass destruction – Wikipedia, accessed December 24, 2025, https://en.wikipedia.org/wiki/South_Africa_and_weapons_of_mass_destruction
  14. North Africa/Israel: Seth Carus and Dov Zakheim – Commission to Assess the Ballistic Missile Threat to the United States, accessed December 24, 2025, https://irp.fas.org/threat/missile/rumsfeld/pt1_africa.htm
  15. The 22 September 1979 Event – CIA, accessed December 24, 2025, https://www.cia.gov/readingroom/docs/DOC_0000037625.pdf
  16. The Vela Flash: Forty Years Ago | National Security Archive, accessed December 24, 2025, https://nsarchive.gwu.edu/briefing-book/nuclear-vault/2019-09-22/vela-flash-forty-years-ago
  17. Revisiting the 1979 VELA Mystery: A Report on a Critical Oral History Conference, accessed December 24, 2025, https://www.wilsoncenter.org/blog-post/revisiting-1979-vela-mystery-report-critical-oral-history-conference
  18. Once Top Secret images reveal evidence of above ground nuclear test, explosion, accessed December 24, 2025, https://ycitynews.com/26204/news/once-top-secret-images-reveal-evidence-of-above-ground-nuclear-test-explosion/
  19. Sent By: – . – 5 – 2 7 – 8 4 1 1: 4 6 Lanl-Nis-817037908724 2 – Scribd, accessed December 24, 2025, https://www.scribd.com/document/492267608/7738
  20. Navy Lab Concludes the Vela Saw a Bomb – Sci-Hub, accessed December 24, 2025, https://2024.sci-hub.se/4650/b83ccdd6467049e5601c72294e512e89/marshall1980.pdf
  21. Walking the Tightrope: Jimmy Carter’s Foreign Policy for a Nuclear Armed South Africa – UVIC, accessed December 24, 2025, https://www.uvic.ca/humanities/history/assets/docs/harry-davies—honours-thesis-2020—final.pdf
  22. Here’s How Radioactive Sheep Indicate That The Vela Incident Was A Secretive Nuclear Explosion | IFLScience, accessed December 24, 2025, https://www.iflscience.com/heres-how-radioactive-sheep-indicate-that-the-vela-incident-was-a-secretive-nuclear-explosion-49275
  23. The 22 September 1979 Vela Incident: The Detected Double-Flash – Science & Global Security, accessed December 24, 2025, https://scienceandglobalsecurity.org/archive/sgs25wright.pdf
  24. The 22 September 1979 Vela Incident: Radionuclide and Hydroacoustic Evidence for a Nuclear Explosion – Science & Global Security, accessed December 24, 2025, https://scienceandglobalsecurity.org/archive/sgs26degeer.pdf
  25. Online supplement The 22 September 1979 Vela Incident: Radionuclide and Hydroacoustic Evidence for a Nuclear Explosion Appendice – Science & Global Security, accessed December 24, 2025, https://scienceandglobalsecurity.org/archive/sgs26degeer_app.pdf
  26. Vela Incident | Military Wiki – Fandom, accessed December 24, 2025, https://military-history.fandom.com/wiki/Vela_Incident
  27. NPR 1.1: A Chronology of South Africa’s Nuclear Program – James Martin Center for Nonproliferation Studies, accessed December 24, 2025, https://www.nonproliferation.org/wp-content/uploads/npr/masiza11.pdf
  28. Jericho 2 | Missile Threat – CSIS, accessed December 24, 2025, https://missilethreat.csis.org/missile/jericho-2/

Comparative State Decay: Why First World Nations Lag Behind

This report delivers a comprehensive strategic assessment regarding the comparative velocity of state decay between “First World” nations (Advanced Industrial Democracies) and “Second/Third World” nations (Emerging and Developing Economies). Moving beyond superficial metrics of Gross Domestic Product (GDP), this analysis adopts a structural entropy framework. Here, “decay” is rigorously defined not merely as economic contraction, but as the progressive erosion of institutional capacity, social cohesion, and physical resilience—a decline in the state’s ability to convert resources into public goods and solve collective action problems.

The central conclusion of this analysis is that Advanced Economies are currently decaying at a faster rate relative to their own historical baselines than Emerging Economies. This is primarily driven by “institutional sclerosis,” a phenomenon where entrenched distributional coalitions stifle adaptation, and by an unprecedented collapse in social trust. While Emerging Economies face acute volatility, structural brittleness, and “growing pains,” Advanced Economies are suffering from a systemic, degenerative stagnation that is harder to reverse due to the complexity of their established regulatory and legal frameworks.

Our analysis identifies a “Bifurcation of Entropy”:

  1. The West (Sclerosis): Characterized by high capacity but low flexibility. The decay vector is defined by gridlock, vetocracy, and the capture of institutions by interest groups, leading to high costs and low output (e.g., US healthcare, German rail).
  2. The Emerging World (Volatility): Characterized by rising capacity but low quality control. The decay vector is defined by corruption, authoritarian overreach, and “tofu-dreg” infrastructure, leading to rapid expansion prone to catastrophic failure.

Crucially, the “Trust Inversion” identified in 2024—where developing populations trust their governments significantly more than developed populations trust theirs—represents a fundamental threat to the long-term stability of Western liberal democracies. Combined with the “Grey Swan” of demographic senescence, the First World faces a period of inevitable contraction in state services, while the Developing World (with the notable exception of China) retains demographic vitality.

This report details these findings across five core dimensions: Institutional, Economic, Social, Physical, and Demographic, supported by a proprietary analytical methodology.

1. Introduction: The Anatomy of State Decay

The geopolitical narrative of the 21st century has largely focused on the “rise of the rest,” presuming a convergence where developing nations catch up to the developed world. However, a more critical analysis suggests a different dynamic: the active decay of the developed world. To “think like a national analyst” requires us to strip away the veneer of wealth and examine the structural integrity of the state.

1.1 Defining “State Decay”

For the purposes of this strategic assessment, we reject the simplified notion of decay as synonymous with recession or poverty. Instead, we define “In a State of Decay” through the lens of political entropy and systems theory:

State Decay is the measurable decline in a nation’s Institutional Capacity (the ability to execute policy), Adaptive Efficiency (the speed of response to new challenges), and Legitimacy (the voluntary compliance of the governed). It occurs when a society creates challenges (complexity) faster than its institutions can process and solve them.

This definition draws upon Francis Fukuyama’s concept of political decay, which he posits occurs when institutions fail to adapt to changing circumstances due to intellectual rigidity or elite capture.1 It is the rigidification of the status quo that prevents necessary reform, turning stability into stagnation.

1.2 The Comparative Matrix of Decay

To rigorously assess whether the “First World” is decaying faster than the “Second” or “Third,” this report utilizes a multi-dimensional analytical matrix. The following summary table aggregates the key findings detailed in the subsequent sections, contrasting the trajectory of Advanced Economies (e.g., USA, UK, Germany, Japan) against Major Emerging Economies (e.g., China, India, Brazil).

Table 1: Comparative Strategic Matrix of National Decay Indicators (2000–2024)

DimensionPrimary MetricAdvanced Economies (First World) TrendEmerging Economies (Second/Third World) TrendComparative Velocity of Decay
InstitutionalLegislative Productivity & GridlockHigh Velocity Decay: Systemic paralysis; rise of “vetocracy”; sharp decline in legislative output relative to agenda size.3Low/Mixed Decay: High executive efficiency (often authoritarian); rapid policy implementation but prone to unchecked errors.5First World Decaying Faster (via Sclerosis)
InstitutionalPolitical PolarizationHigh Velocity Decay: “Toxic” polarization in US/UK; erosion of democratic norms and breakdown of compromise.6High Velocity Decay: Sharp rise in polarization in Brazil/India; trend toward autocratization and exclusion.7Convergent Decay (Both deteriorating rapidly)
EconomicDebt Sustainability & LeverageModerate Decay: Unsustainable debt-to-GDP (>120% in US); reliance on reserve currency privilege to delay correction.9Structural Risk: Rising debt but lower baselines; China is the outlier with “First World” debt levels and “Second World” income.10First World More Vulnerable (Long-term solvency)
SocialPublic Trust & LegitimacySevere Decay: Trust in government/media at historic lows (<50%); profound alienation of the “masses” from “elites”.11Negative Decay (Improvement): Higher trust levels (>60%); optimism regarding economic future; strong nationalist cohesion.11First World Decaying Faster (Crisis of Legitimacy)
PhysicalInfrastructure ResilienceModerate Decay: “Fix-it-first” crisis; aging legacy systems; high maintenance costs; slow upgrades (e.g., German rail).14Quality Volatility: Rapid build-out plagued by “tofu-dreg” quality issues; safety failures; high speed but low durability.15Qualitatively Different (Senescence vs. Brittleness)
DemographicWorkforce VitalityTerminal Decay: Shrinking workforces; collapsing dependency ratios (more retirees than workers).17Divergent: India/Africa enjoying demographic dividend; China/Russia facing “premature aging” collapse.18First World Decaying Faster (except China/Russia)

The data suggests a bifurcation in the entropy process: The First World is suffering from Institutional Sclerosis (stiffening joints), while the Emerging World is suffering from Institutional Malformation (weak bones). The following sections analyze these dimensions in exhaustive detail.

2. Theoretical Framework: The Mechanics of Societal Decline

To accurately assess if the First World is decaying faster, we must first establish the theoretical mechanisms of decline. This report utilizes a synthesized framework drawing from political economy, historical sociology, and complexity theory.

2.1 Mancur Olson and Institutional Sclerosis

The primary lens for understanding Western decay is the theory of Institutional Sclerosis, introduced by economist Mancur Olson in The Rise and Decline of Nations (1982). Olson argued that stable societies naturally accumulate special interest groups (lobbyists, unions, industry cartels) over time. These groups act as “distributional coalitions” that focus on rent-seeking—fighting to redistribute existing wealth—rather than creating new wealth.20

  • The Mechanism of Decay: As these groups multiply, they capture the legislative and regulatory apparatus. They demand subsidies, tax breaks, and regulations that protect their incumbents from competition. This results in a “sclerotic” economy that is slow to adapt to new technologies or shocks.
  • Relevance to the First World: Olson explicitly noted that countries with long periods of stability (like the UK or US) eventually suffer slower growth than those whose institutional slate was wiped clean (like post-war Germany or Japan). Today, however, Germany and Japan have themselves become “old” stable regimes, exhibiting the very sclerosis Olson predicted.20
  • The “Vetocracy”: In modern political science, this accumulation of interests manifests as a “vetocracy,” where too many actors have the power to say “no” to a policy, but no single actor has the power to say “yes”.22

2.2 Francis Fukuyama and Political Decay

Expanding on Olson, Francis Fukuyama defines political decay as a function of Institutional Rigidity vs. Social Evolution. Institutions are created to solve the problems of a specific era. When society changes (demographically, technologically, economically) but institutions remain rigid due to cognitive stagnation or elite defense of the status quo, decay sets in.1

Fukuyama identifies “repatrimonialization” as a key vector of decay in advanced democracies. This is the process where public institutions, originally designed to be impersonal and meritocratic, are recaptured by powerful elites who use them for private gain—essentially a reversion to a feudal-style patronage system masked by modern bureaucracy.23

2.3 Peter Turchin and Elite Overproduction

Completing the triad is Peter Turchin’s “Structural-Demographic Theory” (SDT). Turchin identifies Elite Overproduction as a primary driver of instability. When a society produces more elite aspirants (wealthy, highly educated individuals seeking power) than there are positions of power available, competition becomes toxic.24

  • Counter-Elites: Frustrated aspirants who are locked out of power turn into “counter-elites,” mobilizing the immiserated masses against the established order. This leads to political fragmentation and violence. Turchin’s models successfully predicted the spike in social unrest in the US and Europe in the 2020s.24

Synthesis: Under this framework, a state is decaying if it has:

  1. Sclerosis: Too many interest groups blocking adaptation (Olson).
  2. Rigidity: Institutions that cannot reform due to elite capture (Fukuyama).
  3. Discord: Intra-elite conflict and mass immiseration (Turchin).

3. Institutional Decay: The Paralysis of Power vs. The Peril of Autocracy

The most profound divergence between the First and Second/Third Worlds lies in the functionality of their political institutions. The First World is defined by gridlock, while the Emerging World is defined by concentration.

3.1 The West: Institutional Sclerosis and the Vetocracy

The United States and Western Europe act as the primary case studies for Institutional Sclerosis. The hallmark of this decay is not the absence of government activity, but the diminishing returns on that activity—massive inputs of political capital yielding negligible policy outputs.

3.1.1 Legislative Productivity and the Gridlock Trap

Quantitative analysis of the US Congress reveals a stark trend of declining functional capacity. According to Sarah Binder’s legislative gridlock metrics, the gap between the “agenda size” (problems that need solving) and “legislative enactments” (laws passed to solve them) has widened significantly since the mid-20th century.4

  • The Productivity Paradox: While the number of bills introduced often remains high, the substantive legislative output has cratered. A Pew Research Center analysis of the 115th Congress noted that while 442 public laws were enacted, nearly a third were purely ceremonial (e.g., renaming post offices). The “major legislation index” shows a long-term decline in the enactment of structural reforms.27
  • The Mechanism of Failure: This paralysis is structural. The proliferation of veto points—filibusters, committee holds, partisan polarization—has made it mathematically improbable to pass complex legislation without supermajorities, which rarely exist in a polarized electorate. This fits Olson’s description of a society choked by its own checks and balances.20

3.1.2 UK and Germany: The Bureaucratic Quagmire

Institutional sclerosis is not unique to the US.

  • United Kingdom: The “doom loop” of public service performance, as described by the Institute for Government, highlights a state where spending increases but outcomes deteriorate. The NHS and criminal justice systems are stuck in a cycle of crisis management, unable to implement long-term reforms due to political volatility and entrenched inefficiencies.30
  • Germany: Often cited as the paragon of efficiency, Germany is currently exhibiting classic symptoms of sclerosis. The “traffic light” coalition government has struggled to pass basic budgetary or energy reforms due to conflicting interest groups within the coalition. The decay of the Bundeswehr (armed forces) and Deutsche Bahn (rail) reveals a bureaucracy that has become so complex it can no longer maintain its own assets.14

3.2 The Emerging World: The Trap of Autocratization

In contrast, emerging economies like India, Brazil, and China are not suffering from sclerosis (too many checks) but from the erosion of checks—”autocratization.”

3.2.1 Efficiency at the Cost of Accountability

Autocratic or hybrid regimes can bypass the “vetocracy” that plagues the West. China can build high-speed rail networks in a decade that would take California a century. However, this “efficiency” masks a different form of decay: the accumulation of catastrophic errors.

  • The Accountability Deficit: Without feedback loops (free press, opposition parties), errors in policy (e.g., China’s Zero-COVID policy or the One Child Policy) are not corrected until they cause systemic damage. This is “Institutional Malformation”—the skeleton is growing fast but is brittle.5

3.2.2 India and Brazil: Toxic Polarization

V-Dem (Varieties of Democracy) data indicates that political polarization in Brazil and India has reached “toxic” levels, comparable to or exceeding that of the US.

  • India: Since 2013, India has seen a steep rise in polarization coinciding with the centralization of executive power. While this allows for decisive action (avoiding Western-style gridlock), it increases the risk of social unrest and policy volatility.7
  • Brazil: The Bolsonaro era demonstrated how fragile democratic institutions in the Second World remain. Unlike the US, where institutions “bent but didn’t break” on January 6th, Brazil’s institutions faced a near-existential stress test, saved largely by the judiciary acting with aggressive (and controversial) authority.32

Comparative Insight: The First World’s decay is characterized by inaction (the inability to build or reform due to complexity). The Second/Third World’s decay is characterized by unaccountable action (the ability to build/reform rapidly but often corruptly or ineffectively).

4. Economic Dimensions: Stagnation and the Debt Trap

Economic decay is often misdiagnosed as simple recession. True structural decay is found in the divergence between debt accumulation and productivity growth.

4.1 The Productivity Slump: Secular Stagnation

Since the 2008 financial crisis, advanced economies have entered a period of “secular stagnation.” Labor productivity growth in the US, UK, and Eurozone has decelerated significantly compared to the post-WWII era and the 1990s tech boom.33

  • The Innovation Illusion: Despite the hype around AI and tech, Total Factor Productivity (TFP) growth remains sluggish. This suggests that new technologies are not diffusing into the broader economy to create widespread wealth, but are instead concentrated in narrow sectors—a sign of the “dual economy” typical of decaying states.
  • The Rent-Seeking Shift: As predicted by Olson, capital in advanced economies increasingly flows into asset speculation (real estate, stocks) rather than productive capacity. This “financialization” extracts value rather than creating it.33

4.2 The Debt Overhang: Buying Time

The most glaring indicator of First World decay is the reliance on public debt to mask this structural stagnation. When growth fails, the state borrows to maintain the illusion of prosperity.

  • United States: Public debt-to-GDP has risen from roughly 55.6% in 2000 to over 126.9% in 2024.9 This trajectory is mathematically unsustainable without significant currency devaluation or default.
  • United Kingdom: Similarly, UK debt has tripled from 36.6% to 105.9% in the same period.9
  • The “Cost of Stagnation”: Visualizing this data reveals a damning trend. The advanced economies are borrowing massive amounts of capital to generate diminishing amounts of growth. This is the definition of diminishing marginal returns on complexity.

4.3 The Emerging Comparison

Emerging Markets exhibit a different profile. While they also have debt issues, their productivity growth remains higher, implying a better “return on leverage.”

  • Productivity Gap: Labor productivity growth in emerging economies (excluding China) averaged 1.3-3.5% in recent decades, consistently outperforming the sub-1% growth often seen in the West.34
  • The China Exception: China is the outlier. With a corporate and private debt load that rivals or exceeds Western levels (reaching nearly 300% of GDP when all sectors are combined), China is exhibiting “First World” debt decay characteristics before achieving “First World” income levels.10

5. Social Dimensions: The Collapse of Cohesion

Perhaps the most striking evidence that the First World is decaying faster is found in the social fabric. Social cohesion is the “dark matter” of state power; without it, institutions cannot function.

5.1 The Trust Gap: An Inversion of Legitimacy

The 2024 Edelman Trust Barometer reveals a startling geopolitical inversion. Historically, Western democracies prided themselves on high social trust. Today, the opposite is true.

  • The Collapse: In the UK, trust in government has fallen to 30%. In the US, it hovers around 40%. Germany has seen a 9-point decline in trust in business and government over the last decade.11
  • The Rise: Conversely, developing nations report the highest levels of trust. China (79%), India (76%), and Indonesia (74%) lead the world in public confidence in institutions.11

Insight: This is not merely a reflection of state propaganda in authoritarian regimes (though that plays a role). It reflects a tangible optimism in populations that are seeing their lives improve (absolute gains), whereas Western populations perceive stagnation and decline (relative losses). The “American Dream” of intergenerational mobility is now more statistically likely to occur in parts of Asia than in the US.37

5.2 Social Mobility and the “Class Ceiling”

The Global Social Mobility Index (WEF) and OECD data confirm that the “social elevator” is broken in the West.

  • Sticky Floors and Ceilings: In the US and UK, income inequality has entrenched a “mass-class divide.” The number of generations it takes for a low-income family to reach the mean income is significantly higher in the OECD (4-5 generations) than in the Nordic countries, but the trend in the Anglosphere is worsening.37
  • Elite Isolation: Following Turchin’s theory, Western elites have become detached from the populace, leading to a “loss of noblesse oblige” and the rise of populism as a counter-reaction.

5.3 Order and Violence

While the First World remains safer on aggregate, the trendline is concerning.

  • US Homicide: The US remains a violent outlier among developed nations, with homicide rates fluctuating but remaining structurally high compared to Europe.
  • Latin America: Conversely, while nations like Brazil and Mexico have high absolute violence, some regions are seeing improvements due to aggressive state capacity building (though often via illiberal means).39

6. Physical Dimensions: Infrastructure and Demographics

6.1 Infrastructure: The “Fix-It-First” Dilemma

Infrastructure is the physical manifestation of state capacity. Here, the First World suffers from the burden of its own history.

  • The US/Germany (Crumbling): The ASCE Report Card typically grades US infrastructure in the “C-” to “C” range. The core issue is maintenance. The US has built a massive sprawling network that it can no longer afford to maintain. This is the “growth Ponzi scheme”—new developments pay for old ones until growth slows, and the maintenance bill comes due.41
  • German Rail Case Study: Deutsche Bahn, once a symbol of Prussian efficiency, is now characterized by chronic delays. This is the result of decades of “living off the capital” of the past—underinvesting in maintenance to balance budgets. Reversing this requires massive disruption, which the vetocracy struggles to authorize.14

6.2 The “Tofu-Dreg” Phenomenon

  • China (Cracking): China’s infrastructure growth is miraculous in speed but suspect in durability. The term “tofu-dreg projects” (buildings that crumble like tofu) refers to the prevalence of poor construction quality due to corruption and speed. Bridges collapsing and roads washing away are common.15

Comparison: Western infrastructure is decaying due to neglect and high costs (vetocracy). Eastern infrastructure risks decay due to corruption and speed. However, the West’s problem is harder to solve because it requires political will to disrupt existing stakeholders, whereas the East’s problem is technical and regulatory.

6.3 Demographic Decay: The Biological Clock

Demographics act as the “biological” clock of state decay.

  • The West: Europe and Japan are in advanced demographic decay. The dependency ratio (workers to retirees) is collapsing. By 2050, the number of people aged 65+ is projected to double globally, but the fiscal impact will hit the rich world first. This will mathematically force a contraction in state services or an explosion in debt—there is no third option.17
  • The “Second World” Anomaly: Russia and China face demographic outlooks even worse than the US. China’s population is aging faster than it is enriching, a unique form of “premature decay.” This puts China in a “First World” decay trap without the “First World” wealth cushion.18
  • The “Third World” Dividend: India and Sub-Saharan Africa retain youthful populations. If institutions can capitalize on this (a big “if”), they have a vitality advantage the First World lacks.19

7. Synthesis: The Relative Velocity of Decay

To answer the user’s core query, we must distinguish between Absolute Decay and Relative Velocity of Decay.

7.1 The Argument for “Yes” (The First World is Decaying Faster)

  1. Complexity Trap: Advanced societies have reached a level of complexity where the marginal return on investment in complexity is negative (Joseph Tainter’s theory). Every new law, regulation, or infrastructure project costs exponentially more than the last.4
  2. Social Entropy: The collapse of shared meaning and trust in the West is more advanced. The “Second World” still possesses nationalism or developmental ambition that binds society; the West is fragmenting into identity groups.1
  3. Fiscal Exhaustion: The West has promised a welfare state it can no longer afford demographically, leading to a slow-motion insolvency crisis. The debt accumulation in the US and UK (tripling since 2000) without commensurate growth is a clear signal of systemic rot.9

7.2 The Counter-Argument (The Developing World is Fragile)

  1. Low Baselines: “Decay” in the Third World often looks like catastrophic failure (civil war, state collapse) rather than the slow stagnation of the West. The Fragile States Index shows that the absolute risk of collapse remains concentrated in the Global South.46
  2. Authoritarian Brittleness: While China creates infrastructure efficiently, its lack of rule of law creates hidden risks (debt bubbles, ghost cities) that could lead to a sudden, nonlinear collapse rather than a slow decline.

7.3 Conclusion: The State of Decay

The evidence strongly supports the conclusion that The First World is decaying faster in terms of institutional adaptability and social cohesion. It is suffering from a “rich man’s disease”—gout and sclerosis. It has the resources to fix its problems but lacks the political will and organizational capacity to do so.

The Second/Third World is not “decaying” in the same sense; it is often struggling to form. Its failures are those of immaturity rather than senescence. However, China represents a hybrid: a developing nation contracting a developed nation’s diseases (aging, debt, sclerosis) before fully maturing.

Final Verdict:

  • The First World is in a state of advanced “entropic decay” (gradual decline of capacity).
  • The Emerging World is in a state of “structural volatility” (high risk of sudden failure).

If “decay” is defined as the irreversible loss of problem-solving capacity, the First World is decaying faster. Its institutions are harder to reform because they are cemented by centuries of law and interest groups (institutional sclerosis), whereas developing nations, though volatile, retain greater plasticity.

Appendix A: Methodology for Assessing State Decay

A.1 Conceptual Framework

The methodology used in this report integrates three primary theoretical models:

  1. Olson’s Logic of Collective Action: Measures the accumulation of interest groups and regulatory complexity (Institutional Sclerosis).20
  2. Fukuyama’s Political Decay: Measures the autonomy and capacity of state bureaucracy versus elite capture.1
  3. Turchin’s Cliodynamics: Measures “elite overproduction” and immiseration as precursors to instability.24

A.2 Data Sources and Metrics

The analysis relies on a synthesis of quantitative indices and qualitative assessments:

  • Governance: World Bank Worldwide Governance Indicators (WGI) – specifically “Government Effectiveness” and “Control of Corruption”.48
  • Social Cohesion: Edelman Trust Barometer (Trust Index) and V-Dem Polarization Index.6
  • Fiscal Health: IMF Global Debt Database (Public/Private Debt-to-GDP).49
  • Demographics: UN Population Division (Dependency Ratios).17
  • Infrastructure: ASCE Report Cards and comparative analysis of capital project efficiency.41

A.3 Limitations

  • Data Lag: Indices like WGI often lag real-time events by 1-2 years.
  • Definition of “First World”: The term is outdated; this report uses “Advanced Economies” (IMF definition) as a proxy.
  • Regime Type Bias: Some metrics (like legislative gridlock) punish democracies for being deliberative while rewarding autocracies for being “efficient,” even if that efficiency is coercive.

If you find this post useful, please share the link on Facebook, with your friends, etc. Your support is much appreciated and if you have any feedback, please email me at in**@*********ps.com. Please note that for links to other websites, we are only paid if there is an affiliate program such as Avantlink, Impact, Amazon and eBay and only if you purchase something. If you’d like to directly contribute towards our continued reporting, please visit our funding page.


Sources Used

  1. accessed December 18, 2025, https://en.wikipedia.org/wiki/Political_decay#:~:text=Francis%20Fukuyama%20refers%20to%20political,equilibrium%20of%20established%20political%20order.
  2. Political decay – Wikipedia, accessed December 18, 2025, https://en.wikipedia.org/wiki/Political_decay
  3. Legislative Productivity of the U.S. Congress, 1789–2004 – TRACE: Tennessee Research and Creative Exchange, accessed December 18, 2025, https://trace.tennessee.edu/utk_polipubs/1/
  4. 3 Charts that Capture the Rise in Congressional Gridlock – Brookings Institution, accessed December 18, 2025, https://www.brookings.edu/articles/3-charts-that-capture-the-rise-in-congressional-gridlock/
  5. Worldwide Governance Indicators – World Bank, accessed December 18, 2025, https://www.worldbank.org/en/publication/worldwide-governance-indicators
  6. V-Dem, accessed December 18, 2025, https://www.v-dem.net/
  7. Political Polarization in Three Regional Powers – Graph of the Week – V-Dem, accessed December 18, 2025, https://v-dem.net/weekly_graph/political-polarization-in-three-regional-powers
  8. V-DEM Democracy Report 2025 25 Years of Autocratization, accessed December 18, 2025, https://www.v-dem.net/documents/54/v-dem_dr_2025_lowres_v1.pdf
  9. How Debt-to-GDP Ratios Have Changed Since 2000 – Visual Capitalist, accessed December 18, 2025, https://www.visualcapitalist.com/how-debt-to-gdp-ratios-have-changed-since-2000/
  10. Countries with Highest Debt-to-GDP 2024 Rankings – Voronoi, accessed December 18, 2025, https://www.voronoiapp.com/debt/Countries-with-Highest-Debt-to-GDP-2024-Rankings-1833
  11. 2024 Edelman Trust Barometer Supplemental Report Insights for Tech, accessed December 18, 2025, https://www.edelman.com/sites/g/files/aatuss191/files/2024-03/2024%20Edelman%20Trust%20Barometer%20Supplemental%20Report%20Insights%20for%20Tech.pdf
  12. 2024 Edelman Trust Barometer Global Report, accessed December 18, 2025, https://www.edelman.com/sites/g/files/aatuss191/files/2024-02/2024%20Edelman%20Trust%20Barometer%20Global%20Report_FINAL.pdf
  13. 2024 Edelman Trust Barometer, accessed December 18, 2025, https://www.edelman.com/trust/2024/trust-barometer
  14. accessed December 18, 2025, https://monocle.com/business/transport/germanys-train-chaos-how-did-deutsche-bahn-go-off-the-rails/#:~:text=Deutsche%20Bahn’s%20woes%20run%20deep,infrastructure%20fell%20into%20disrepair%20overnight.
  15. Tofu-dreg project – Wikipedia, accessed December 18, 2025, https://en.wikipedia.org/wiki/Tofu-dreg_project
  16. India’s infrastructure woes: A closer look at quality vs quantity – The Economic Times, accessed December 18, 2025, https://m.economictimes.com/opinion/et-commentary/indias-infrastructure-woes-a-closer-look-at-quality-vs-quantity/articleshow/112022939.cms
  17. Old-age dependency ratio, 2023 – Our World in Data, accessed December 18, 2025, https://ourworldindata.org/grapher/age-dependency-ratio-old
  18. How Severe Are China’s Demographic Challenges? – ChinaPower Project, accessed December 18, 2025, https://chinapower.csis.org/china-demographics-challenges/
  19. Chapter 2. Aging in the U.S. and Other Countries, 2010 to 2050 | Pew Research Center, accessed December 18, 2025, https://www.pewresearch.org/global/2014/01/30/chapter-2-aging-in-the-u-s-and-other-countries-2010-to-2050/
  20. Institutional sclerosis – Wikipedia, accessed December 18, 2025, https://en.wikipedia.org/wiki/Institutional_sclerosis
  21. 8 Absolute and Relative Effects of Interest Groups on the Economy*, accessed December 18, 2025, https://heckeljc.sites.wfu.edu/papers/published/CollectiveChoice8.pdf
  22. China Ranks 97th out of 142 in Rule of Law Index – World Justice Project, accessed December 18, 2025, https://worldjusticeproject.org/sites/default/files/documents/China_1.pdf
  23. Understanding Political Decay and Its Effects on Society | by Matt Harder – Medium, accessed December 18, 2025, https://mattharder.medium.com/understanding-political-decay-and-its-effects-on-society-c29be59ce87c
  24. Social Instability Lies Ahead, Researcher Says – UConn Today, accessed December 18, 2025, https://today.uconn.edu/2016/12/using-social-science-to-predict-the-future/
  25. Cliodynamics of End Times: Elites, Counter-Elites and the Path of Political Disintegration, accessed December 18, 2025, https://events.ceu.edu/2023-10-25/cliodynamics-end-times-elites-counter-elites-and-path-political-disintegration
  26. A Quantitative Prediction for Political Violence in the 2020s – Peter Turchin, accessed December 18, 2025, https://peterturchin.com/quantitative-prediction-political-violence-2020s/
  27. 115th Congress passed more laws than before, but of similar substance, accessed December 18, 2025, https://www.pewresearch.org/short-reads/2019/01/25/a-productivity-scorecard-for-115th-congress/
  28. Are long weekends reducing Congress’ productivity? – R Street Institute, accessed December 18, 2025, https://www.rstreet.org/commentary/are-long-weekends-reducing-congress-productivity/
  29. Mancur Olson The Rise And Decline Of Nations – riomaisseguro.rio.rj.gov.br, accessed December 18, 2025, https://riomaisseguro.rio.rj.gov.br/download/browse/mAYIqC/Mancur_Olson_The_Rise_And_Decline_Of_Nations.pdf
  30. Progress on public services has been slower than hoped | Institute for Government, accessed December 18, 2025, https://www.instituteforgovernment.org.uk/comment/one-year-labour-public-services
  31. How Labour can fix our broken public services | British Politics and Policy at LSE, accessed December 18, 2025, https://blogs.lse.ac.uk/politicsandpolicy/how-labour-can-fix-our-broken-public-services/
  32. Democratic Recovery After Significant Backsliding: Emergent Lessons, accessed December 18, 2025, https://carnegieendowment.org/research/2025/04/democratic-recovery-after-significant-backsliding-emergent-lessons?lang=en
  33. Stagnation and Social Structures of Accumulation – PERI UMASS, accessed December 18, 2025, https://peri.umass.edu/publication/stagnation-and-social-structures-of-accumulation/
  34. Investing in productivity growth | McKinsey, accessed December 18, 2025, https://www.mckinsey.com/mgi/our-research/investing-in-productivity-growth
  35. GLOBAL DEBT MONITOR 2024 – International Monetary Fund, accessed December 18, 2025, https://www.imf.org/external/datamapper/GDD/2024%20Global%20Debt%20Monitor.pdf
  36. 2024 Edelman Trust Barometer Reveals Innovation has Become a New Risk Factor for Trust, accessed December 18, 2025, https://www.edelman.com/news-awards/2024-edelman-trust-barometer
  37. The Global Social Mobility Report 2020 Equality, Opportunity and a New Economic Imperative, accessed December 18, 2025, https://www3.weforum.org/docs/Global_Social_Mobility_Report.pdf
  38. Social mobility and equal opportunity – OECD, accessed December 18, 2025, https://www.oecd.org/en/topics/sub-issues/social-mobility-and-equal-opportunity.html
  39. List of countries by intentional homicide rate – Wikipedia, accessed December 18, 2025, https://en.wikipedia.org/wiki/List_of_countries_by_intentional_homicide_rate
  40. GLOBAL STUDY ON HOMICIDE – Executive summary – Unodc, accessed December 18, 2025, https://www.unodc.org/documents/data-and-analysis/gsh/Booklet1.pdf
  41. Infrastructure’s upward momentum reflected in report card – ASCE, accessed December 18, 2025, https://www.asce.org/publications-and-news/civil-engineering-source/civil-engineering-magazine/issues/magazine-issue/article/2025/03/infrastructures-upward-momentum-reflected-in-report-card
  42. Who Sprawls Most? How Growth Patterns Differ Across the U.S. – Brookings Institution, accessed December 18, 2025, https://www.brookings.edu/articles/who-sprawls-most-how-growth-patterns-differ-across-the-u-s/
  43. On a turnaround course, Deutsche Bahn significantly reduced losses in 2024, accessed December 18, 2025, https://www.deutschebahn.com/en/presse/press_releases/On-a-turnaround-course-Deutsche-Bahn-significantly-reduced-losses-in-2024-13323564
  44. China: Multiple Roads And Bridges Collapse Leaving Over 100 Dead, Poor Quality ‘Tofu-dreg’ Infrastructure Comes Under Scrutiny – Swarajya, accessed December 18, 2025, https://swarajyamag.com/infrastructure/china-multiple-roads-and-bridges-collapse-leaving-over-100-dead-poor-quality-tofu-dreg-infrastructure-comes-under-scrutiny
  45. Leaving No One Behind In An Ageing World – the United Nations, accessed December 18, 2025, https://www.un.org/development/desa/dspd/wp-content/uploads/sites/22/2023/01/2023wsr-chapter1-.pdf
  46. Indicators | Fragile States Index, accessed December 18, 2025, https://fragilestatesindex.org/indicators/
  47. Fragile States Index – Wikipedia, accessed December 18, 2025, https://en.wikipedia.org/wiki/Fragile_States_Index
  48. Worldwide Governance Indicators | DataBank – World Bank, accessed December 18, 2025, https://databank.worldbank.org/source/worldwide-governance-indicators
  49. Percent of GDP – Global Debt Database – General Government Debt, accessed December 18, 2025, https://www.imf.org/external/datamapper/GG_DEBT_GDP@GDD/CAN/FRA/DEU/ITA/JPN/GBR/USA

Tactical Santa Photos – Day 12

Ever wonder what Santa is up to these days? We have some photos to share with you each day between now and Christmas Day.

Merry Christmas everyone!! I hope at least a few of these made you smile. To all of our active duty service people and veterans, thank you for your service and God Bless you and your families!


If you find this post useful, please share the link on Facebook, with your friends, etc. Your support is much appreciated and if you have any feedback, please email me at in**@*********ps.com. Please note that for links to other websites, we are only paid if there is an affiliate program such as Avantlink, Impact, Amazon and eBay and only if you purchase something. If you’d like to directly contribute towards our continued reporting, please visit our funding page.


Tactical Santa Photos – Day 11

Ever wonder what Santa is up to these days? We have some photos to share with you each day between now and Christmas Day.

There will be more 🙂


If you find this post useful, please share the link on Facebook, with your friends, etc. Your support is much appreciated and if you have any feedback, please email me at in**@*********ps.com. Please note that for links to other websites, we are only paid if there is an affiliate program such as Avantlink, Impact, Amazon and eBay and only if you purchase something. If you’d like to directly contribute towards our continued reporting, please visit our funding page.


Tactical Santa Photos – Day 10

Ever wonder what Santa is up to these days? We have some photos to share with you each day between now and Christmas Day.

There will be more 🙂


If you find this post useful, please share the link on Facebook, with your friends, etc. Your support is much appreciated and if you have any feedback, please email me at in**@*********ps.com. Please note that for links to other websites, we are only paid if there is an affiliate program such as Avantlink, Impact, Amazon and eBay and only if you purchase something. If you’d like to directly contribute towards our continued reporting, please visit our funding page.


Tactical Santa Photos – Day 9

Ever wonder what Santa is up to these days? We have some photos to share with you each day between now and Christmas Day.

There will be more 🙂


If you find this post useful, please share the link on Facebook, with your friends, etc. Your support is much appreciated and if you have any feedback, please email me at in**@*********ps.com. Please note that for links to other websites, we are only paid if there is an affiliate program such as Avantlink, Impact, Amazon and eBay and only if you purchase something. If you’d like to directly contribute towards our continued reporting, please visit our funding page.


Tactical Santa Photos – Day 8

Ever wonder what Santa is up to these days? We have some photos to share with you each day between now and Christmas Day.

There will be more 🙂


If you find this post useful, please share the link on Facebook, with your friends, etc. Your support is much appreciated and if you have any feedback, please email me at in**@*********ps.com. Please note that for links to other websites, we are only paid if there is an affiliate program such as Avantlink, Impact, Amazon and eBay and only if you purchase something. If you’d like to directly contribute towards our continued reporting, please visit our funding page.