
The question of whether the United States is in a state of decay is not merely a matter of partisan rhetoric but a subject of profound geopolitical and sociological consequence. A rigorous analysis of the nation’s trajectory reveals a complex, bifurcated reality that defies simple binary categorization. The United States is not experiencing a uniform collapse analogous to historical empires, but rather a phenomenon of asymmetric divergence. The nation possesses robust, world-leading capacity in high-technology innovation, energy independence, and aggregate economic output (“hard power”), while simultaneously suffering from profound structural corrosion in social cohesion, institutional trust, human capital metrics, and fiscal sustainability (“soft infrastructure”).
This report applies a modified political decay framework—drawing upon the scholarship of Samuel Huntington and Francis Fukuyama—to assess the nation’s health. We define “decay” technically as institutional rigidity combined with repatrimonialization (capture by special interests) and a declining capacity to deliver public goods effectively.
Our analysis identifies three critical vectors of active decay:
Institutional Sclerosis: The U.S. political system displays symptoms of “vetocracy,” where polarization has rendered legislative mechanisms incapable of addressing long-term structural challenges. Trust in government has collapsed to near-historic lows (approx. 17-20%), creating a legitimacy deficit that decouples state power from state authority.
Social Fragmentation and Biological Regression: Uniquely among advanced economies, the U.S. has experienced periods of declining life expectancy and stagnant educational outcomes. The phenomenon of “deaths of despair”—driven by opioids, suicide, and metabolic disease—indicates a degradation of the social fabric that economic growth figures fail to capture.
Fiscal Unsustainability: The trajectory of the national debt, now exceeding 120% of GDP, coupled with rising debt-servicing costs, represents a long-term threat to state capacity that political gridlock prevents addressing.
However, the “Decay” hypothesis is strongly contradicted by significant counter-trends of resilience and renewal:
Technological Hegemony: The U.S. maintains a commanding lead in artificial intelligence (AI) investment (approx. 12x that of China) and generative model development. This suggests a private sector capable of generating “technological escape velocity” that may offset institutional stagnation.
Energy and Resource Dominance: The U.S. has achieved status as the world’s leading oil and gas producer, insulating it from the energy shocks that constrain peer competitors in Europe and Asia.
Geopolitical Endurability: While the gap with China has narrowed, the U.S. retains a distinct advantage in comprehensive power, alliance networks, and cultural soft power.
Conclusion: The United States is not in a state of terminal collapse but is undergoing Corrosive Bifurcation. The “state” (as an administrative entity) and the “market” (as an engine of wealth) remain powerful, but the “nation” (as a cohesive social and biological community) is decaying. The risk is not immediate conquest or economic depression, but a long-term stratification where high-growth enclaves of extreme wealth and innovation coexist with broad swathes of institutional failure, social anomie, and stagnant mobility.
1. Introduction: Defining and Measuring Decay
To assess the trajectory of a superpower requires a precise methodology that moves beyond partisan grievance or headline volatility. “Decay” in a political science context is a specific technical condition, not merely a synonym for decline. Following the frameworks established by Samuel Huntington in Political Order in Changing Societies and expanded by Francis Fukuyama in Political Order and Political Decay, we define Political Decay as a condition where governmental institutions fail to adapt to changing social and economic circumstances due to intellectual rigidity or capture by interest groups.1
Huntington posited that decay occurs when social modernization (the mobilization of new groups into politics) outpaces political institutionalization (the capacity of the state to absorb and regulate that participation). Fukuyama expands this by identifying “repatrimonialization”—the process by which elites capture state institutions for private gain—as a primary driver of decay.1 In this framework, a wealthy, powerful nation can still be in a state of decay if its institutions lose the autonomy and flexibility required to solve new problems.
This report assesses decay across five primary dimensions, which serve as the pillars of our methodology:
- Political & Institutional Health: The ability of the state to govern effectively, the legitimacy it commands, and the level of polarization.
- Social & Human Capital: The biological and social well-being of the citizenry, including life expectancy, education, and social mobility.
- Economic Structure: The distribution of wealth, fiscal sustainability, and standard of living (distinct from aggregate GDP).
- Physical Capacity: The state of infrastructure, energy resilience, and the physical environment.
- Geopolitical Standing: Relative power projection compared to peer competitors and soft power influence.
The following dashboard summarizes the high-level findings detailed in the subsequent sections, contrasting areas of resilience with areas of active decay.
Summary of Systemic Indicators
| Dimension | Primary Metric | Trend Direction | Severity of Decay | Key Observation |
| Political | Trust in Government | Negative (Critical) | High | Trust near historic lows; polarization prevents consensus on structural reform.3 |
| Social | Life Expectancy | Negative (Divergent) | High | US life expectancy lags peer nations by ~4 years; driven by “deaths of despair”.5 |
| Economic | Debt-to-GDP | Negative | Medium-High | Debt exceeds 120% of GDP; interest payments rising, but currency privilege mitigates immediate crisis.6 |
| Innovation | AI Investment | Positive | None (Leading) | US private investment in AI is ~12x that of China; innovation engine remains robust.7 |
| Physical | Infrastructure Grade | Stable/Mixed | Medium | ASCE Grade “C-“; slight improvement from “D+” but massive investment backlog remains.8 |
| Geopolitics | Asia Power Index | Negative (Relative) | Low-Medium | US remains #1 but lead over China has narrowed; US leads in alliances/soft power.9 |
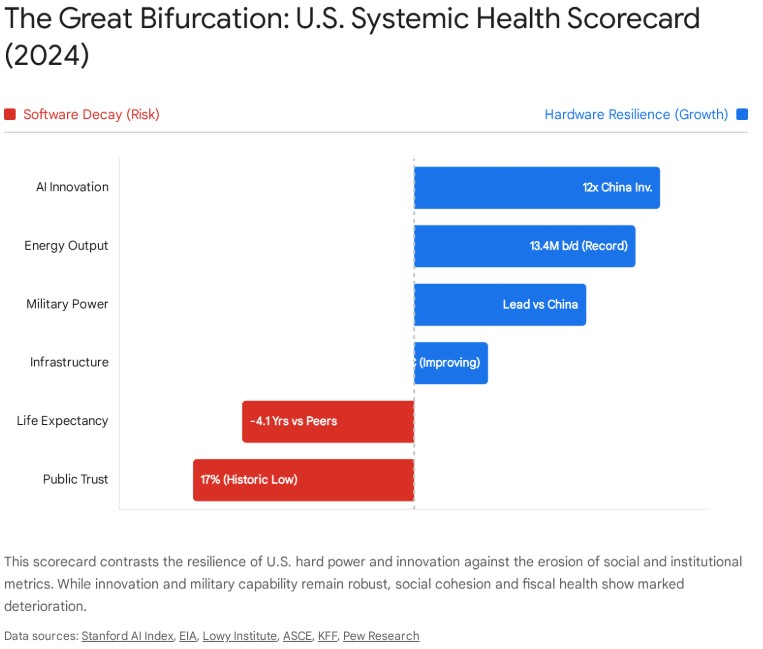
The data indicates that the United States is not experiencing a uniform collapse, but rather a hollowing out of the social and institutional middle. The mechanisms of state adaptability—the ability to pass budgets, reform entitlement programs, or maintain public health—are degrading, even as the mechanisms of wealth generation (tech, energy) accelerate. This paradox defines the current American condition.
2. The Political Dimension: Institutional Sclerosis and Polarization
The primary indicator of political decay is the gap between the demands placed on the state and its capacity to respond. In the United States, this dimension manifests as a profound crisis of trust, effectiveness, and institutional flexibility. The constitutional architecture, designed in the 18th century to prevent tyranny through an intricate system of checks and balances, has, in the context of modern hyper-polarization, mutated into a “vetocracy”—a system where stopping action is significantly easier than taking it.
2.1 The Collapse of Institutional Trust and Legitimacy
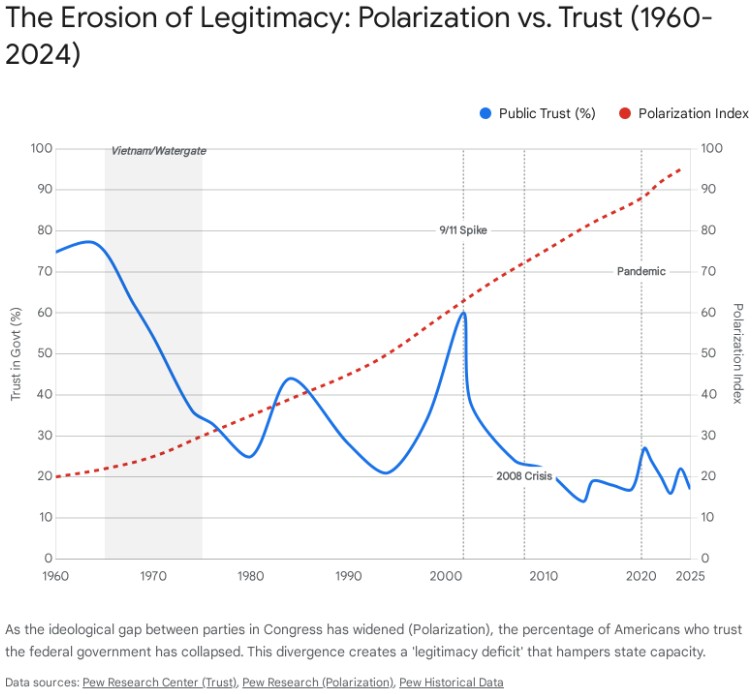
The bedrock of any democratic state is the legitimacy accorded to it by its citizens. By this metric, the United States has undergone a severe and prolonged decay. Public trust in the federal government has deteriorated to historic lows, a trend that is not cyclical but structural.
As of late 2023 and 2024, only roughly 17-20% of Americans stated they trust the government to do what is right “just about always” or “most of the time”.3 This represents a catastrophic decline from the mid-20th century. In 1964, trust stood at an all-time high of 77%. Even following the tumult of the Vietnam War and Watergate, trust rebounded to nearly 60% in the immediate aftermath of the 9/11 attacks in 2001.10
However, this recovery was decisively reversed by the 2008 Global Financial Crisis, a pivotal event highlighted in the timeline below. The crisis, characterized by a housing market collapse and a massive government bailout of financial institutions, marked a turning point in the American social contract. For many citizens, the state’s response—prioritizing the solvency of banks while millions faced foreclosure and unemployment—permanently severed the psychological bond between the government and the governed. This economic trauma catalyzed a decade of “secular stagnation” and fueled the rise of anti-establishment populism on both the left (e.g., Occupy Wall Street) and the right (e.g., the Tea Party), accelerating the polarization trend visible in the data.4 The current nadir has persisted for over a decade, suggesting a permanent decoupling of the citizenry from the state.
This decline is not uniform but is characterized by “conditional legitimacy.” Trust has become a lagging indicator of partisan control. Republicans express trust only when a Republican is president, and Democrats reciprocate, but the overall baseline continues to drift lower. This “partisan oscillation” means that at any given moment, approximately half the country views the federal apparatus as illegitimate or hostile to their interests.12 Furthermore, while trust in local government remains comparatively higher, it too is eroding, indicating that the crisis of confidence is filtering down from the national to the community level.12
This collapse in trust is an operational constraint on governance. It reduces voluntary tax compliance, increases resistance to public health mandates (as seen during the COVID-19 pandemic), and heightens instability during leadership transitions. When citizens believe the system is rigged or incompetent, they withdraw their consent, forcing the state to rely more on coercion or financial inducements, both of which are costly and inefficient.
2.2 Polarization as Systemic Paralysis
Political polarization in the United States has transitioned from “ideological divergence” (disagreement on policy) to “affective polarization” (emotional animosity), where dislike of the opposing party exceeds affinity for one’s own. This shift has fundamentally altered the incentives of governance.
Research indicates that this polarization is asymmetric, driven significantly by a rightward shift among Republicans in Congress since the 1970s, though partisan antipathy has deepened across the spectrum.4 The number of Americans holding “very unfavorable” views of the opposing party has reached record highs.4
The practical consequence of this polarization is legislative decline. While the absolute number of laws passed can fluctuate (often inflated by massive omnibus bills), measures of “Legislative Effectiveness” reveal a hollowing out of the lawmaking process. The Center for Effective Lawmaking notes that legislative effectiveness is increasingly concentrated in party leadership, rendering rank-and-file legislators less effective at advancing substantive policy.13 This centralization stifles innovation and local representation.
The U.S. political system is unique in the number of “veto players” it empowers—the Senate filibuster, powerful committees, a bicameral legislature, an independent judiciary, and federalism. In a low-polarization environment, these checks encourage compromise. In a high-polarization environment, they are weaponized to prevent the opposing party from governing. This leads to what Fukuyama terms “status quo bias” or rigidity: the system cannot adapt to new realities (such as climate change, fiscal deficits, or immigration pressures) because any proposed solution is immediately blocked by a veto player.1 This inability to adapt is the hallmark of political decay.
2.3 Corruption and “Repatrimonialization”
Fukuyama argues that a key mechanism of decay is “repatrimonialization,” where the state is captured by powerful elites who use political power to protect their economic interests. In the U.S., this does not typically take the form of petty bribery but rather “legalized” institutional corruption.
The Transparency International Corruption Perceptions Index (CPI) reflects this concern. While the U.S. remains in the upper tier of “clean” nations globally, its score has shown a concerning downward trend over the last decade. From scores consistently in the mid-70s, the U.S. has slipped to roughly 69 in recent assessments.16 This decline places the U.S. behind many other advanced democracies.
The mechanism of this capture includes the influence of lobbying, the opacity of campaign finance (dark money), and the “revolving door” between regulatory agencies and the industries they regulate. This creates a perception—and reality—that government procedures have lost their autonomy to outside agents, fulfilling Huntington’s definition of decay as a decrease in institutional autonomy.1 When policy outcomes (e.g., tax complexity, healthcare pricing) consistently favor organized interest groups over the general public, the state can be said to be in a state of capture.
Verdict on Political Dimension: High State of Decay. The system exhibits classic symptoms of rigidity, polarization, and capture. It retains stability through inertia and immense wealth, but its capacity to generate consensus-based reform has severely atrophied.
3. The Economic Dimension: Aggregate Hegemony vs. Structural Fragility
Economically, the United States presents the most contradictory picture of any dimension in this analysis. By aggregate metrics, it is a global juggernaut, outperforming peers and defying predictions of decline. By distributive and fiscal metrics, however, it shows signs of profound structural weakness and fragility.
3.1 Aggregate Strength: The Unrivaled Engine
Contrary to narratives of economic eclipse, the U.S. economy remains the world’s largest by nominal GDP and second by Purchasing Power Parity (PPP).18 In 2024, U.S. GDP per capita (PPP) reached an all-time high of approximately $75,491, significantly outpacing other major economies.19 Furthermore, the U.S. share of the global economy has remained remarkably resilient, hovering between 25-26% in nominal terms for decades. This defies the historical pattern of declining hegemons; unlike the British Empire, which saw its share of global GDP collapse, the U.S. has maintained its slice of the pie even as the pie itself has grown.18
This resilience is underpinned by the U.S. dollar’s role as the global reserve currency, a “exorbitant privilege” that allows the U.S. to borrow cheaply and maintain trade deficits that would crush other nations.
3.2 Distributive Stagnation and Inequality
However, this aggregate growth has not been shared broadly, leading to what some economists call “Secular Stagnation” for the working and middle classes.21 The wealth gap has created two distinct economies: an asset-owning class that benefits from financialization and tech growth, and a wage-earning class sensitive to inflation and cost-of-living shocks.
While nominal median household income has risen, real purchasing power has stagnated for significant periods. Adjusted for inflation (CPI), median household income in 2021 was roughly comparable to pre-pandemic levels. More critically, long-term growth for the median worker has been modest compared to top-tier income growth.22
The Gini coefficient, a standard measure of inequality, remains high by OECD standards (approx. 0.48 for the U.S. vs. ~0.3 for many European peers).23 This level of inequality correlates with social instability and reduced intergenerational mobility, feeding back into the political polarization discussed previously.
3.3 The Fiscal Time Bomb
Perhaps the most quantifiable metric of “decay”—defined as borrowing against the future to fund current consumption—is the national debt. The gross federal debt to GDP ratio has exploded from roughly 30-40% in 1980 to over 120% in the 2020s.6
This debt is not merely a result of crisis spending (2008 Financial Crisis, COVID-19 pandemic) but of structural imbalance. The U.S. consistently spends more than it collects, driven by mandatory entitlement programs (Social Security, Medicare) and defense spending, coupled with periodic tax cuts.
As interest rates normalized in 2023-2024 following the inflationary spike, the cost of servicing this debt has skyrocketed. Interest payments on the national debt are poised to exceed defense spending, threatening to crowd out discretionary spending on infrastructure, education, and R&D. This is a classic indicator of a “mature” power in decline—spending more on past obligations (debt and entitlements) than on future capacity.
3.4 Innovation as the Counter-Narrative
Despite these headwinds, the U.S. innovation engine refutes the narrative of total economic ossification. In the critical domain of Artificial Intelligence (AI), the U.S. is not decaying; it is accelerating.
In 2024, U.S. private investment in AI reached $109.1 billion, nearly 12 times that of China ($9.3 billion).7 The U.S. produced 61 notable AI models in 2023 compared to China’s 15, dominating the frontier of generative AI.25
This suggests that while the public sector decays (debt, gridlock), the private sector retains immense vitality. The U.S. is unique in its ability to attract global talent and capital to its tech sector, providing a “moat” against absolute economic decline. This “Innovation Exception” is the single strongest argument against the thesis of systemic decay.
Verdict on Economic Dimension: Mixed. The private sector remains dynamic and world-leading (Resilient), while the public fiscal framework and wealth distribution mechanisms are degrading (Decaying).
4. Social Fabric and Human Capital: The “Deaths of Despair”
A nation is ultimately comprised of its people. If the population is becoming sicker, dying younger, and losing hope, the state is in decay regardless of its GDP or military might. In this dimension, the United States is a global outlier among developed nations, exhibiting trends that are typically associated with the collapse of the Soviet Union rather than a thriving democracy.
4.1 The Life Expectancy Crisis
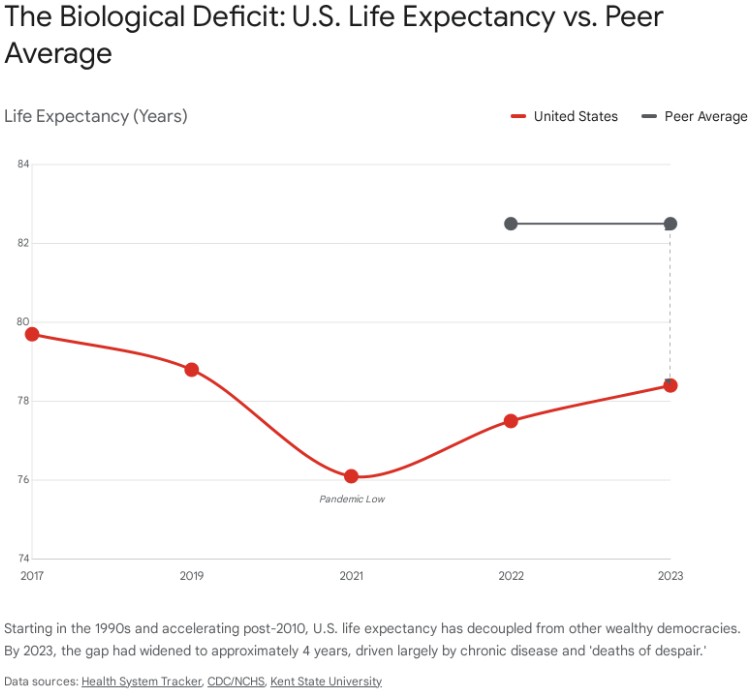
Life expectancy is the “canary in the coal mine” for social health. For most of the 20th century, U.S. life expectancy rose in tandem with other wealthy nations. However, beginning in the 1990s and accelerating in the 2010s, a “Great Divergence” occurred.
U.S. life expectancy at birth was 78.4 years in 2023. While this represents a slight recovery from the COVID-19 nadir, it remains significantly below the OECD peer average of approximately 82.5 years—a gap of roughly four years.5
Crucially, between 2010 and 2019—before the pandemic—U.S. life expectancy growth plateaued (gaining only 0.1 years), while peer nations gained an average of 1.2 years.5 This indicates that the rot is structural and pre-existing. The divergence is driven not by infant mortality, but by mid-life mortality: chronic disease (obesity, diabetes), homicides, and, most alarmingly, “deaths of despair.”
4.2 Deaths of Despair: Opioids and Suicide
The term “deaths of despair,” coined by economists Anne Case and Angus Deaton, refers to deaths from suicide, drug overdose, and alcoholic liver disease. These deaths have surged among Americans without a college degree, driving the mortality trends described above.28
The Opioid Epidemic: The opioid crisis continues to ravage the workforce and families. While some specific overdose rates showed stabilization in 2023 (e.g., heroin deaths down 33%), the overall burden remains catastrophic compared to historical norms and peer nations.29 The introduction of fentanyl has turned addiction into mass casualty events.
Suicide Rates: Suicide rates have trended upward since 2000, correlating with regions of economic deindustrialization and social fragmentation.28 This contrasts with many European nations where suicide rates have fallen or remained stable.
Social Fragmentation: This biological decay is mirrored by social decay. Participation in community organizations has declined, replaced by “horizontal fragmentation” where citizens retreat into like-minded enclaves (digital and physical), reducing social trust and the “social capital” necessary for a functioning democracy.30
4.3 Education and Social Mobility
The “American Dream” is predicated on social mobility—the idea that talent and hard work allow anyone to rise. However, the data suggests this engine is seizing up.
Stagnant Mobility: Data indicates that intergenerational mobility in the U.S. is now lower than in many European “welfare states” often criticized for their rigidity. The correlation between a father’s earnings and a son’s earnings is higher in the U.S. (elasticity of 0.47) than in peer OECD countries (where lower is better), indicating significant class entrenchment.32 Geography has become destiny; a child’s future is heavily determined by the zip code of their birth.33
Education Stagnation: The PISA 2022 results show U.S. students scoring average in math (465) compared to the OECD average, significantly trailing leaders like Singapore (575).34 While reading and science scores are better, the lack of significant improvement over decades—despite high per-pupil spending—suggests institutional inefficiency. The U.S. education system excels at the tertiary level (universities) but fails to provide a competitive baseline for the median student at the K-12 level.
Verdict on Social Dimension: Severe Decay. The biological and social health of the American population is deteriorating in absolute terms (life expectancy) and relative terms (education/mobility). This is the most acute vector of decay.
5. The Physical Dimension: Infrastructure and Environment
State capacity is also physical: the ability to maintain the roads, bridges, ports, and power grids that underpin the economy. A decaying state literally crumbles; a thriving state builds.
5.1 The ASCE Report Card: A Slow Climb from Failure
For decades, U.S. infrastructure was notoriously graded “D” (Poor). The 2021 American Society of Civil Engineers (ASCE) Report Card finally raised the cumulative grade to a “C-“.8
This slight improvement reflects increased investment (through state gas taxes and federal infrastructure bills). Ports (B-) and Rail (B) are bright spots, benefiting from private investment and strategic importance.
However, a “C-” still implies “mediocre, requiring attention.” Critical sectors like Aviation (D+), Dams (D), and Roads (D) remain in poor condition.35 The investment gap is estimated at $2.59 trillion over 10 years.36 The persistence of “poor” grades in foundational infrastructure acts as a drag on economic productivity (a “congestion tax”) and a risk to public safety.
5.2 Grid Reliability: The Fragility of Modernity
A strictly First World problem that has become a distinct U.S. weakness is the reliability of the electric grid.
Reliability metrics like SAIDI (System Average Interruption Duration Index) have worsened in recent years. In 2024, excluding major events, the average interruption duration was roughly 126 minutes, but including major events (weather), it spiked to over 660 minutes in some datasets.37
The U.S. grid is aging and increasingly vulnerable to extreme weather events. Unlike peers in Europe or Asia who bury lines or modernize transmission infrastructure faster, the U.S. utility model (fragmented, regulated monopolies) has been slower to adapt, leading to a “resilience gap”.38 Frequent power outages in a digital economy represent a significant failure of state planning and utility regulation.
5.3 Energy Dominance: A Critical Asset
Conversely, in terms of raw energy production, the U.S. has reversed a trend of decay. The “Shale Revolution” has made the United States the world’s largest producer of oil and natural gas.39 In August 2024, U.S. crude oil production reached a record 13.4 million barrels per day.41 This energy independence is a massive strategic asset, insulating the U.S. economy from the types of energy shocks that have crippled European industry following the war in Ukraine. This is a clear example of where the U.S. has successfully adapted and grown, countering the narrative of general decline.
Verdict on Physical Dimension: Moderate Decay with Strategic Bright Spots. The trend has shifted from “rapid decay” to “stabilization,” but the backlog of deferred maintenance remains a massive liability. Energy independence provides a crucial buffer.
6. Geopolitical Standing: Relative vs. Absolute Power
The debate over American decline often conflates domestic health with international power. A nation can decay internally while remaining the dominant global hegemon (e.g., the late Roman Empire or the Ottoman Empire).
6.1 The Rise of China and the Narrowing Gap
The Lowy Institute’s Asia Power Index (2024) ranks the United States as the #1 power in Asia, but notes its power score has fallen to its lowest level since the index began in 2018.42
The gap between the U.S. (Score 80.5) and China (Score 73.7) is narrowing. China has eroded U.S. advantages in military capability and economic relationships.9
However, the “Thucydides Trap” narrative often ignores China’s own internal decay. The Lowy report notes that “China faces too many long-term constraints” (demographics, slowing growth) to fully eclipse the U.S..9 This suggests the U.S. is not necessarily falling behind a continuously rising giant, but rather that both superpowers are grappling with internal constraints in a “competitive endurance” contest.
6.2 Soft Power and Alliance Networks
Contrary to the “decline” narrative, U.S. soft power remains resilient. The Brand Finance Global Soft Power Index 2024 ranked the U.S. #1 for the third consecutive year.43 The U.S. leads in familiarity, influence, and media reach.
More importantly, the U.S. possesses “network power”—a system of formal alliances (NATO, AUKUS, Japan/Korea treaties) that China lacks. This acts as a force multiplier, preserving U.S. influence even as its relative share of the global economy diminishes slightly.
6.3 Military and Strategic Power
The U.S. continues to outspend the next 10 nations combined on defense. While China builds ships faster, the U.S. retains qualitative superiority in key domains: nuclear submarines, 5th-generation aircraft, and combat experience. The ability to project power globally remains unmatched, even if the margin of superiority has shrunk.
Verdict on Geopolitical Dimension: Relative Decline, Absolute Strength. The U.S. is no longer the uncontested hyperpower of the 1990s, but it remains the world’s indispensable power. Its external decay is relative (others catching up), not absolute.
7. Conclusion: The Corrosive Bifurcation
Is the United States of America in a state of decay?
The Analyst’s Conclusion:
The United States is in a state of Advanced Institutional and Social Decay, masked by Economic and Technological Dynamism.
It is not experiencing the “total collapse” seen in historical examples like the Soviet Union. Instead, it is experiencing a divergent evolution:
- The “Hardware” is Strong: The U.S. economy, military, geography, resources, and innovation ecosystem remain the envy of the world. The private sector continues to generate wealth and technology at a pace no other nation can match. By these metrics, there is no decay—only evolution and growth.
- The “Software” is Corrupted: The mechanisms that bind the nation together—trust, shared truth, social mobility, public health, and functional governance—are rotting. The political system has lost the capacity to solve structural problems, and the social system is failing to protect the biological well-being of the population.
The Trajectory:
If this divergence continues, the U.S. will not cease to be a superpower, but it will increasingly resemble a “high-capacity developing nation”: an opulent, armed, and technologically advanced elite functioning atop a crumbling public infrastructure and a socially fragmented, unhealthy populace.
The “State of Decay” is therefore real, but it is containable. The decay is located in the institutions and the social contract, not in the capacity or talent of the nation. Reversing it requires not economic stimulus (of which there is plenty), but political reformation—breaking the “vetocracy” and restoring the feedback loops between the government and the governed. The challenge for the United States is not to become rich or powerful again, but to become functional and cohesive again.
If you find this post useful, please share the link on Facebook, with your friends, etc. Your support is much appreciated and if you have any feedback, please email me at in**@*********ps.com. Please note that for links to other websites, we are only paid if there is an affiliate program such as Avantlink, Impact, Amazon and eBay and only if you purchase something. If you’d like to directly contribute towards our continued reporting, please visit our funding page.
8. Works Cited
- Fukuyama, Francis. “Political Order and Political Decay.” Farrar, Straus and Giroux, 2014. (Referenced via Snippets 1).
- Huntington, Samuel P. “Political Order in Changing Societies.” Yale University Press, 1968. (Referenced via Snippets 1).
- Pew Research Center. “Public Trust in Government: 1958-2025.” Pew Research Center, Dec 4, 2025. (Snippet 3).
- Pew Research Center. “Political Polarization in the American Public.” Pew Research Center, June 12, 2014. (Snippet 46).
- Kaiser Family Foundation (KFF). “U.S. Life Expectancy Compared to Other Countries.” Health System Tracker, 2024. (Snippet 5).
- Federal Reserve Economic Data (FRED). “Gross Federal Debt as Percent of Gross Domestic Product.” St. Louis Fed, 2024. (Snippet 6).
- Stanford HAI. “2025 AI Index Report: Economy.” Stanford University, 2025. (Snippet 7).
- American Society of Civil Engineers (ASCE). “2021 Report Card for America’s Infrastructure.” ASCE, 2021. (Snippet 10).
- Lowy Institute. “Asia Power Index 2024 Key Findings Report.” Lowy Institute, 2024. (Snippet 9).
- Pew Research Center. “Trust in Government 1958-2015.” Pew Research Center, Nov 23, 2015. (Snippet 10).
- Gallup. “Trust in State and Local Governments, by Political Party.” Gallup News, 2025. (Snippet 12).
- Center for Effective Lawmaking. “Legislative Effectiveness Scores.” TheLawmakers.org, Nov 19, 2025. (Snippet 13).
- Volden, Craig, and Alan E. Wiseman. “Legislative Effectiveness in the United States Congress.” Cambridge University Press, 2014. (Snippet 14).
- Fukuyama, Francis. “America in Decay.” Foreign Affairs, 2014. (Snippet 15).
- Transparency International. “Corruption Perceptions Index 2024.” Transparency International, 2024. (Snippet 47).
- Transparency International. “Corruption Perceptions Index 2012.” Transparency International, 2012. (Snippet 48).
- World Bank. “GDP, PPP (current international $) – United States.” World Bank Data, 2024. (Snippet 49).
- Trading Economics. “United States GDP per capita PPP.” Trading Economics / World Bank, 2024. (Snippet 19).
- Visual Capitalist. “U.S. Share of Global Economy Over Time.” Visual Capitalist, 2024. (Snippet 20).
- Monthly Review. “Stagnation and Financialization.” Monthly Review, 2024. (Snippet 50).
- U.S. Bureau of Labor Statistics. “Purchasing Power of the Consumer Dollar.” BLS, 2023. (Snippet 22).
- JPMorgan Chase Institute. “Household Purchasing Power 2019 to 2022.” JPMorgan Chase, 2022. (Snippet 51).
- World Bank. “Gini Index – United States.” World Bank Data, 2024. (Snippet 52).
- Stanford HAI. “2024 AI Index Report.” Stanford University, 2024. (Snippet 26).
- Stanford HAI. “2024 AI Index Report: Technical Performance.” Stanford University, 2024. (Snippet 25).
- Stanford HAI. “2024 AI Index Report: Economy.” Stanford University, 2024. (Snippet 53).
- CDC/NCHS. “Life Expectancy in the U.S. 2023.” NCHS Data Brief No. 521, Nov 2024. (Snippet 27).
- Case, Anne, and Angus Deaton. “Deaths of Despair and the Future of Capitalism.” Princeton University Press, 2020. (Snippet 28).
- CDC/NCHS. “Drug Overdose Deaths in the United States, 2003–2023.” NCHS Data Brief No. 522, 2024. (Snippet 29).
- Royal Society Interface. “The effect of social balance on social fragmentation.” Royal Society Publishing, 2020. (Snippet 31).
- Cambridge University Press. “Citizen among Institutions: Fragmentation and Trust.” Social Policy and Society, 2024. (Snippet 54).
- Economic Policy Institute. “USA Lags Peer Countries in Mobility.” EPI, 2012. (Snippet 32).
- Visual Capitalist. “Ranked: The Best and Worst American Cities for Economic Mobility.” Visual Capitalist, 2024. (Snippet 33).
- OECD. “PISA 2022 Results: The State of Learning and Equity in Education.” OECD Publishing, 2023. (Snippet 34).
- ASCE. “2021 Report Card: Aviation, Dams, Roads.” InfrastructureReportCard.org, 2021. (Snippet 10).
- ASCE. “Failure to Act: Economic Impacts of Status Quo Investment.” ASCE, 2021. (Snippet 36).
- U.S. Energy Information Administration (EIA). “Annual Electric Power Industry Report (Form EIA-861).” EIA, 2024. (Snippet 37).
- S&C Electric Company. “Trends in Reliability and Resilience—The Growing Resilience Gap.” S&C Electric, 2022. (Snippet 38).
- Wikipedia. “List of countries by oil extraction.” Wikipedia, 2024. (Snippet 56).
- U.S. Energy Information Administration (EIA). “Today in Energy: U.S. Crude Oil Production Record.” EIA, Nov 13, 2024. (Snippet 41).
- U.S. Energy Information Administration (EIA). “Permian region crude oil production.” EIA, 2024. (Snippet 57).
- Lowy Institute. “Asia Power Index 2024: United States.” Lowy Institute, 2024. (Snippet 58).
- Brand Finance. “Global Soft Power Index 2024.” Brand Finance, Feb 29, 2024. (Snippet 59).
Appendix: Methodology
A.1 Framework of Analysis
This report utilized a “Dimensions of State Capacity” framework, synthesizing three primary academic models:
- Huntington’s Political Decay: Measuring the ratio of institutionalization to participation to determine stability.
- Fukuyama’s “Getting to Denmark” Model: Assessing State Capacity, Rule of Law, and Democratic Accountability.
- Case & Deaton’s Social Welfare Model: Using “deaths of despair” and life expectancy as proxies for deep social health.
A.2 Data Selection and Sources
Research material was aggregated from high-credibility sources across multiple domains:
- Quantitative Economic Data: Federal Reserve Economic Data (FRED) for debt and GDP; World Bank for inequality metrics.
- Social & Health Data: Centers for Disease Control (CDC) for mortality; OECD/PISA for education; UN Population Division for demographics.
- Political & Institutional Data: Pew Research Center for trust and polarization; Transparency International for corruption; Center for Effective Lawmaking for legislative output.
- Geopolitical Data: Lowy Institute Asia Power Index; Brand Finance Soft Power Index; Stanford HAI AI Index.
A.3 Interpretation of “Decay”
“Decay” was operationalized not as “negative growth” but as “structural regression.” For example, a rising GDP does not disprove decay if life expectancy is falling; it merely highlights the nature of the decay (wealth without health). The analysis prioritized “structural” metrics (institutions, health, education) over “flow” metrics (quarterly GDP, stock prices) to identify long-term trajectories rather than short-term cycles. Consideration was given to distinguishing between absolute decay (metrics getting worse in real terms) and relative decay (metrics improving slower than competitors).
If you find this post useful, please share the link on Facebook, with your friends, etc. Your support is much appreciated and if you have any feedback, please email me at in**@*********ps.com. Please note that for links to other websites, we are only paid if there is an affiliate program such as Avantlink, Impact, Amazon and eBay and only if you purchase something. If you’d like to directly contribute towards our continued reporting, please visit our funding page.
Sources Used
- Political decay – Wikipedia, accessed December 18, 2025, https://en.wikipedia.org/wiki/Political_decay
- Stanford’s Francis Fukuyama on Political Order and Political Decay – YouTube, accessed December 18, 2025, https://www.youtube.com/watch?v=jSh6XmGmZak
- Public Trust in Government: 1958-2025 – Pew Research Center, accessed December 18, 2025, https://www.pewresearch.org/politics/2025/12/04/public-trust-in-government-1958-2025/
- Political polarization in the United States – Wikipedia, accessed December 18, 2025, https://en.wikipedia.org/wiki/Political_polarization_in_the_United_States
- How does U.S. life expectancy compare to other countries?, accessed December 18, 2025, https://www.healthsystemtracker.org/chart-collection/u-s-life-expectancy-compare-countries/
- Gross Federal Debt as Percent of Gross Domestic Product (GFDGDPA188S) | FRED | St. Louis Fed, accessed December 18, 2025, https://fred.stlouisfed.org/series/GFDGDPA188S
- Economy | The 2025 AI Index Report | Stanford HAI, accessed December 18, 2025, https://hai.stanford.edu/ai-index/2025-ai-index-report/economy
- ASCE Report Card Gives U.S. Infrastructure Highest-Ever C Grade, accessed December 18, 2025, https://www.asce.org/publications-and-news/civil-engineering-source/society-news/article/2025/03/25/asce-report-card-gives-us-infrastructure-highest-ever-c-grade
- 2024 Asia Power Index Key Findings Report – Lowy Institute, accessed December 18, 2025, https://www.lowyinstitute.org/publications/2024-asia-power-index-key-findings-report
- 1. Trust in government: 1958-2015 – Pew Research Center, accessed December 18, 2025, https://www.pewresearch.org/politics/2015/11/23/1-trust-in-government-1958-2015/
- Trends in U.S. income and wealth inequality – Pew Research Center, accessed December 18, 2025, https://www.pewresearch.org/social-trends/2020/01/09/trends-in-income-and-wealth-inequality/
- U.S. Trust in Government Depends Upon Party Control – Gallup News, accessed December 18, 2025, https://news.gallup.com/poll/697421/trust-government-depends-upon-party-control.aspx
- Legislative Effectiveness Scores – Center for Effective Lawmaking, accessed December 18, 2025, https://thelawmakers.org/category/legislative-effectiveness-scores
- Effective Lawmaking across Congressional Eras | The Journal of Politics: Vol 86, No 3, accessed December 18, 2025, https://www.journals.uchicago.edu/doi/10.1086/729963
- Understanding Political Decay and Its Effects on Society | by Matt Harder – Medium, accessed December 18, 2025, https://mattharder.medium.com/understanding-political-decay-and-its-effects-on-society-c29be59ce87c
- Corruption Perceptions Index, 2024 – Our World in Data, accessed December 18, 2025, https://ourworldindata.org/grapher/ti-corruption-perception-index
- Corruption Perceptions Index – Wikipedia, accessed December 18, 2025, https://en.wikipedia.org/wiki/Corruption_Perceptions_Index
- Economy of the United States – Wikipedia, accessed December 18, 2025, https://en.wikipedia.org/wiki/Economy_of_the_United_States
- United States GDP per capita PPP – Trading Economics, accessed December 18, 2025, https://tradingeconomics.com/united-states/gdp-per-capita-ppp
- The U.S. Share of the Global Economy Over Time – Visual Capitalist, accessed December 18, 2025, https://www.visualcapitalist.com/u-s-share-of-global-economy-over-time/
- Economic stagnation – Wikipedia, accessed December 18, 2025, https://en.wikipedia.org/wiki/Economic_stagnation
- Purchasing power and constant dollars – Bureau of Labor Statistics, accessed December 18, 2025, https://www.bls.gov/cpi/factsheets/purchasing-power-constant-dollars.htm
- Economic Inequality – Our World in Data, accessed December 18, 2025, https://ourworldindata.org/economic-inequality
- The 2025 AI Index Report | Stanford HAI, accessed December 18, 2025, https://hai.stanford.edu/ai-index/2025-ai-index-report
- The 2024 AI Index Report | Stanford HAI, accessed December 18, 2025, https://hai.stanford.edu/ai-index/2024-ai-index-report
- Artificial Intelligence Index Report 2024 – AWS, accessed December 18, 2025, https://hai-production.s3.amazonaws.com/files/hai_ai-index-report-2024-smaller2.pdf
- Mortality in the United States, 2023 – CDC, accessed December 18, 2025, https://www.cdc.gov/nchs/products/databriefs/db521.htm
- Long-Term Trends in Deaths of Despair – Joint Economic Committee, accessed December 18, 2025, https://www.jec.senate.gov/public/index.cfm/republicans/2019/9/long-term-trends-in-deaths-of-despair
- Drug Overdose Deaths in the United States, 2003–2023 – CDC, accessed December 18, 2025, https://www.cdc.gov/nchs/products/databriefs/db522.htm
- Fragmentation or Diversification? Ethnoracial Change and the Social and Economic Heterogeneity of Places – PMC – PubMed Central, accessed December 18, 2025, https://pmc.ncbi.nlm.nih.gov/articles/PMC6917860/
- The effect of social balance on social fragmentation | Journal of The Royal Society Interface, accessed December 18, 2025, https://royalsocietypublishing.org/rsif/article/17/172/20200752/36162/The-effect-of-social-balance-on-social
- U.S. lags behind peer countries in mobility | Economic Policy Institute, accessed December 18, 2025, https://www.epi.org/publication/usa-lags-peer-countries-mobility/
- Ranked: The Best and Worst American Cities for Economic Mobility – Visual Capitalist, accessed December 18, 2025, https://www.visualcapitalist.com/ranked-the-best-and-worst-american-cities-for-economic-mobility/
- Fast Facts: International comparisons of achievement (1), accessed December 18, 2025, https://nces.ed.gov/fastfacts/display.asp?id=1
- ASCE’s 2021 report card marks the nation’s infrastructure progress, accessed December 18, 2025, https://www.asce.org/publications-and-news/civil-engineering-source/civil-engineering-magazine/issues/magazine-issue/article/2021/03/asce-2021-report-card-marks-the-nations-infrastructure-progress
- about asce – 2021 Infrastructure Report Card, accessed December 18, 2025, https://2021.infrastructurereportcard.org/wp-content/uploads/2020/12/2021-IRC-Executive-Summary-1.pdf
- Table 11.1 Reliability Metrics of US Distribution System – EIA, accessed December 18, 2025, https://www.eia.gov/electricity/annual/html/epa_11_01.html
- Trends in Reliability and Resilience—The Growing Resilience Gap – S&C Electric Company, accessed December 18, 2025, https://www.sandc.com/globalassets/sac-electric/documents/public—documents/sales-manual-library—external-view/technical-paper-100-t135.pdf?dt=637961663037312086
- Global Natural Gas Production – World Energy Statistics – Enerdata, accessed December 18, 2025, https://yearbook.enerdata.net/natural-gas/world-natural-gas-production-statistics.html
- Natural gas supply – World – IEA, accessed December 18, 2025, https://www.iea.org/world/natural-gas
- U.S. crude oil production established a new record in August 2024 – U.S. Energy Information Administration (EIA), accessed December 18, 2025, https://www.eia.gov/todayinenergy/detail.php?id=63824
- Asia Power Index: United States weakens, China and India rise amid shifting regional dynamics | Lowy Institute, accessed December 18, 2025, https://www.lowyinstitute.org/asia-power-index-united-states-weakens-china-india-rise-amid-shifting-regional-dynamics
- Brand Finance’s Global Soft Power Index 2024: The USA is Crowned the World’s Soft Power Superpower for the 3rd Consecutive Year | Press Release, accessed December 18, 2025, https://brandfinance.com/press-releases/brand-finances-global-soft-power-index-2024-the-usa-is-crowned-the-worlds-soft-power-superpower-for-the-3rd-consecutive-year
- Political Development and Political Decay – Samuel P. Huntington – UT liberal arts, accessed December 18, 2025, https://www.la.utexas.edu/users/chenry/core/Course%20Materials/SPH1965/0.pdf
- Political Development and Political Decay | World Politics | Cambridge Core, accessed December 18, 2025, https://www.cambridge.org/core/journals/world-politics/article/political-development-and-political-decay/A5A8D33F6D3D4061AD1750D711038B42
- Political Polarization in the American Public – Pew Research Center, accessed December 18, 2025, https://www.pewresearch.org/politics/2014/06/12/political-polarization-in-the-american-public/
- Corruption Perceptions Index 2024 – Transparency.org, accessed December 18, 2025, https://www.transparency.org/en/cpi/2024
- 2012 Corruptions Perceptions Index – Explore the… – Transparency.org, accessed December 18, 2025, https://www.transparency.org/en/cpi/2012
- GDP, PPP (current international $) – United States – World Bank Open Data, accessed December 18, 2025, https://data.worldbank.org/indicator/NY.GDP.MKTP.PP.CD?locations=US
- Stagnation and Financialization: The Nature of the Contradiction – Monthly Review, accessed December 18, 2025, https://monthlyreview.org/articles/stagnation-and-financialization/
- The Purchasing Power of Household Incomes from 2019 to 2022 – JPMorganChase, accessed December 18, 2025, https://www.jpmorganchase.com/institute/all-topics/financial-health-wealth-creation/household-purchasing-power-2019-to-2022
- Gini index – United States – World Bank Open Data, accessed December 18, 2025, https://data.worldbank.org/indicator/SI.POV.GINI?locations=US
- Economy | The 2024 AI Index Report | Stanford HAI, accessed December 18, 2025, https://hai.stanford.edu/ai-index/2024-ai-index-report/economy
- Citizen among Institutions. Fragmentation and Trust in Social Assistance | Social Policy and Society – Cambridge Core – Journals & Books Online, accessed December 18, 2025, https://resolve.cambridge.org/core/journals/social-policy-and-society/article/citizen-among-institutions-fragmentation-and-trust-in-social-assistance/87C1B423740AC6A1B9EA6097571E4052
- PISA 2022 Results (Volume I) – OECD, accessed December 18, 2025, https://www.oecd.org/en/publications/pisa-2022-results-volume-i_53f23881-en.html
- List of countries by oil extraction – Wikipedia, accessed December 18, 2025, https://en.wikipedia.org/wiki/List_of_countries_by_oil_extraction
- U.S. associated natural gas production increased 6% in 2024 – U.S. Energy Information Administration (EIA), accessed December 18, 2025, https://www.eia.gov/todayinenergy/detail.php?id=66684
- Compare United States and China – Lowy Institute Asia Power Index, accessed December 18, 2025, https://power.lowyinstitute.org/compare/?countries=united-states,china
- Brand Finance’s Global Soft Power Index 2024: USA and UK ranked top nation brands, China takes third place, overtaking Japan and Germany | Press Release, accessed December 18, 2025, https://brandfinance.com/press-releases/brand-finances-global-soft-power-index-2024-usa-and-uk-ranked-top-nation-brands-china-takes-third-place-overtaking-japan-and-germany