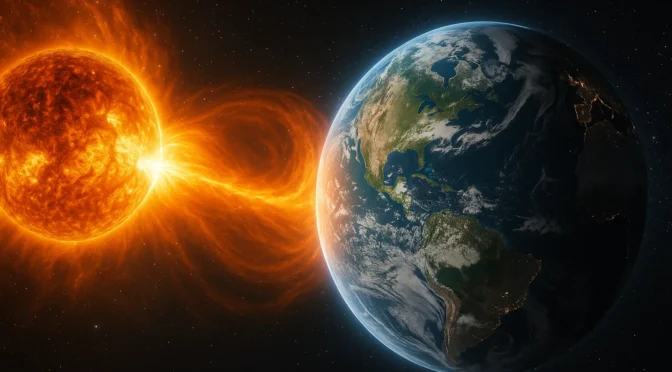
A severe, planet-scale geomagnetic storm, colloquially known as a solar storm, represents one of the most significant and least understood threats to the national security and economic stability of the United States. While the probability of such an event in any given year is low, historical and paleoclimatological records indicate that its eventual occurrence is a matter of statistical certainty.1 An event on the scale of the 1859 Carrington Event, or potentially even stronger, would have catastrophic consequences for the modern, technology-dependent world.
The primary vulnerability of the United States is its national electric power grid. A powerful Coronal Mass Ejection (CME) from the Sun would induce quasi-DC currents into the high-voltage transmission system, causing hundreds of critical extra-high voltage (EHV) transformers to overheat and fail simultaneously. Given that these transformers are custom-built with replacement lead times of one to two years or more, such an event could trigger a widespread, long-duration blackout lasting months or even years.1
This initial failure of the power grid would initiate a cascading collapse across all other critical infrastructure sectors. The loss of electricity would paralyze fuel distribution, water and wastewater systems, communications networks, transportation, healthcare, and the financial system. The nation’s heavy reliance on the Global Positioning System (GPS) for precise timing—a service essential for synchronizing everything from cellular networks to financial transactions—constitutes a second, equally critical single point of failure that would be severely degraded or denied during a major solar storm.
Current national preparedness, guided by the National Space Weather Strategy and Action Plan, has established a framework for monitoring and operational response. However, a significant gap exists between policy and operational reality. Regulatory standards for the power industry focus on assessing vulnerability to a 1-in-100-year event, a benchmark that may be dangerously insufficient. Furthermore, there is no mandate for the widespread physical hardening of the grid, and a recent national-level exercise revealed significant weaknesses in coordinated response capabilities.3
This report provides a comprehensive analysis of the threat, from its solar origins to its terrestrial impacts. It concludes with a set of strategic recommendations aimed at transforming U.S. preparedness from a reactive and procedural posture to a proactive and resilient one. The top-line recommendations are:
- Elevate Extreme Space Weather to a Tier 1 National Security Threat to mobilize the necessary political will and resources.
- Mandate and Fund the Physical Hardening of the Grid, focusing on the installation of GIC-blocking technologies on critical EHV transformers.
- Establish a National Strategic Transformer Reserve to reduce replacement timelines from years to weeks.
- Accelerate the Development and Deployment of GPS-Independent Timing Solutions to mitigate the nation’s critical dependency on a vulnerable space-based system.
The cost of inaction is unacceptably high. A Carrington-class event is a high-impact, low-frequency threat that has the potential to undermine the foundations of modern American society. Proactive investment in resilience is not merely a prudent measure; it is a strategic imperative for preserving national security in the 21st century.
I. The Nature of the Threat: Solar Flares and Geomagnetic Storms
To comprehend the national security implications of extreme space weather, it is essential to first understand the underlying heliophysical phenomena. These events originate from the dynamic and often violent magnetic activity of the Sun and propagate across 93 million miles of space to interact with Earth’s planetary systems.
Solar Dynamics: Flares, Coronal Mass Ejections (CMEs), and the 11-Year Solar Cycle
The Sun is a magnetically active star. Its rotation, which is faster at its equator than at its poles, causes its magnetic field lines to become twisted and tangled over time.4 When these stressed magnetic fields suddenly reconfigure or “reconnect” to a lower-energy state, they release enormous amounts of energy in the form of solar eruptions.5 These eruptions manifest primarily in two forms: solar flares and coronal mass ejections.
A Solar Flare is a giant explosion on the Sun’s surface that releases an intense burst of electromagnetic radiation, including radio waves, extreme ultraviolet (EUV) light, and X-rays.4 This radiation travels at the speed of light, reaching Earth in approximately 8.3 minutes. Consequently, the effects of a flare on Earth’s sunlit side are experienced at the same moment the flare is observed by our space-based instruments.8
A Coronal Mass Ejection (CME) is a distinct but often associated phenomenon. It is a massive expulsion of plasma—a superheated gas of charged particles (primarily protons and electrons)—and its embedded magnetic field from the Sun’s outer atmosphere, the corona.5 A single CME can eject billions of tons of solar material into space at speeds ranging from under 250 km/s to over 3000 km/s.11 While a flare is a flash of light, a CME is a tangible cloud of matter. The fastest, most energetic CMEs can traverse the distance to Earth in as little as 15-18 hours, while slower ones may take several days.10 It is the interaction of an Earth-directed CME with our planet’s magnetic field that produces the most severe and damaging space weather, known as a geomagnetic storm.9
This distinction is fundamental to threat assessment. The flare is the “flash,” causing immediate but often temporary disruptions to radio communications. The CME is the “cannonball,” arriving later but carrying the kinetic energy and magnetic fields that can cripple terrestrial power grids. This phased nature of the threat, with the flare’s arrival serving as a potential harbinger for the more destructive CME impact, provides a critical, albeit short, window for mitigation actions.
Solar activity is not constant; it follows a well-documented 11-year cycle, characterized by periods of high activity (solar maximum) and low activity (solar minimum).7 During solar maximum, the frequency of sunspots, solar flares, and CMEs increases significantly. The current cycle, Solar Cycle 25, is progressing toward its maximum, and has already shown activity exceeding initial predictions, indicating a heightened period of risk for severe space weather in the near term.13
Classification and Severity: Understanding the Threat Scales
To quantify and communicate the severity of space weather events, scientists and forecasters use a set of standardized scales.
Solar Flare Classification (A, B, C, M, X-Class)
Solar flares are classified according to their peak X-ray brightness, measured in the 1 to 8 Angstrom wavelength range.14 The classification system is logarithmic, similar to the Richter scale for earthquakes, with each letter representing a 10-fold increase in energy output.6
- A, B, & C-Class: These are the smallest flares and are generally too weak to have any noticeable effect on Earth.7
- M-Class: These are medium-sized flares that can cause brief radio blackouts affecting Earth’s polar regions and minor radiation storms that could endanger astronauts.7
- X-Class: These are the largest and most intense flares. They can trigger planet-wide radio blackouts and long-lasting radiation storms that pose a significant threat to satellites and high-altitude aircraft.7 Within each class, a finer scale from 1 to 9 is used (e.g., M1, M5, X1, X9). The X-class is open-ended; the most powerful flare measured with modern instruments, in 2003, overloaded sensors that cut out at X28 and was later estimated to be as powerful as X45.6
NOAA Space Weather Scales
The National Oceanic and Atmospheric Administration (NOAA) Space Weather Prediction Center (SWPC) translates the physical measurements of solar events into a set of user-friendly scales that describe their potential impacts on technology and infrastructure.18
- R-Scale (Radio Blackouts): This scale is directly correlated with the intensity of a solar flare’s X-ray output. An R1 (Minor) event corresponds to an M1-class flare, while an R5 (Extreme) event corresponds to an X20 flare or greater. These events cause degradation or complete absorption of high-frequency (HF) radio signals on the sunlit side of the Earth.18
- S-Scale (Solar Radiation Storms): This scale measures the intensity of energetic particle flux near Earth. An S1 (Minor) storm can have small effects on HF radio at the poles, while an S5 (Extreme) storm poses a significant radiation hazard to astronauts, can cause permanent damage to satellites, and can make polar HF radio and navigation operations impossible.18
- G-Scale (Geomagnetic Storms): This is the most critical scale for assessing the threat to the electric power grid. It measures the level of disturbance to Earth’s magnetic field, quantified by an index known as the Planetary K-index, or Kp.20 The scale ranges from G1 (Minor), which can cause weak power grid fluctuations, to G5 (Extreme), which can lead to widespread voltage control problems, protective system failures, and potentially complete grid collapse and permanent transformer damage.18 A Carrington-level event would be classified as a G5 storm.
From Sun to Earth: The Journey of a Geomagnetic Disturbance
The journey of a CME from the Sun to Earth is a complex process. As the massive cloud of plasma and magnetic field travels through interplanetary space, it interacts with the ambient solar wind—the continuous stream of particles flowing outward from the Sun.12 A fast-moving CME will generate a shock wave ahead of it, much like a supersonic jet creates a sonic boom.10 This shock wave can accelerate solar wind particles to very high energies, contributing to the intensity of a solar radiation storm (S-Scale event) that can arrive at Earth even before the CME itself.10
The ultimate impact of a CME on Earth is determined by the characteristics of its embedded magnetic field. Earth is protected by its own magnetic field, the magnetosphere. This shield deflects most of the solar wind. However, a CME’s magnetic field can effectively unlock this shield. If the CME’s magnetic field is oriented southward—that is, opposite to the northward direction of Earth’s magnetic field at the point of impact—a process called magnetic reconnection occurs. This allows a massive and efficient transfer of energy from the CME into Earth’s magnetosphere, driving the intense geomagnetic currents that cause a severe storm.10
A critical factor in the severity of an event is the potential for a “cleared path” multiplier effect. The record-breaking 17.6-hour transit time of the 1859 Carrington Event CME is believed to have been possible because a preceding, smaller CME had already swept through the interplanetary space between the Sun and Earth, clearing away the ambient solar wind plasma.23 This created a low-density “superhighway” that allowed the main CME to travel at an exceptionally high speed. This implies that threat assessment cannot be based solely on the analysis of a single eruption. A sequence of CMEs originating from the same active region and traveling along the same trajectory poses a geometrically higher risk, as the first eruption can precondition the interplanetary environment to allow a subsequent eruption to arrive faster and with greater force than it would have otherwise. This necessitates a shift in forecasting methodology from a purely event-based analysis to a sequence-based risk assessment.
Our only direct warning of an impending CME impact comes from satellites positioned at the Earth-Sun Lagrange Point 1 (L1), approximately one million miles from Earth. Spacecraft like NOAA’s Deep Space Climate Observatory (DSCOVR) can directly measure the speed, density, and magnetic field orientation of the incoming CME plasma.11 This provides a final, definitive warning, but the lead time is extremely short—typically only 15 to 60 minutes before the shock wave hits Earth’s magnetosphere.11
Table 1: Unified Space Weather Threat Matrix
| Solar Event | Flare Class (X-Ray) | R-Scale (Radio Blackout) | S-Scale (Radiation Storm) | G-Scale (Geomagnetic Storm) | Primary Impact & Warning Time |
| Moderate | M1 | R1 (Minor) | S1 (Minor) Possible | G1 (Minor) Possible | Immediate: Minor HF radio degradation on sunlit side. Delayed: Weak power grid fluctuations. Warning: 8 min (flare); 1-4 days (CME). |
| Strong | X1 | R3 (Strong) | S1-S2 (Minor-Moderate) | G2-G3 (Moderate-Strong) | Immediate: Wide-area HF radio blackout for ~1 hour. Delayed: Voltage alarms, potential transformer damage at high latitudes. Warning: 8 min (flare); 1-3 days (CME). |
| Severe | X10 | R4 (Severe) | S3 (Strong) | G4 (Severe) | Immediate: HF blackout on most of sunlit side for hours. Delayed: Widespread voltage control problems, satellite navigation degraded for hours. Warning: 8 min (flare); 1-2 days (CME). |
| Extreme | X20+ | R5 (Extreme) | S4-S5 (Severe-Extreme) | G5 (Extreme) | Immediate: Complete HF blackout on sunlit side for hours. Delayed: Grid collapse, blackouts, transformer damage. Warning: 8 min (flare); 15-18 hours (fast CME). |
II. Mechanisms of Disruption: The Physics of Impact on Modern Technology
A severe geomagnetic storm disrupts modern technology through several distinct physical mechanisms. These impacts can be broadly categorized into three domains: currents induced on the ground, disturbances in the upper atmosphere, and direct particle effects in space. Understanding these mechanisms is crucial for developing effective mitigation strategies.
Geomagnetically Induced Currents (GICs): The Primary Threat to Terrestrial Grids
The most catastrophic threat to national infrastructure from a solar storm comes from Geomagnetically Induced Currents (GICs). The process is a direct application of Faraday’s law of induction, which states that a time-varying magnetic field will induce an electric field, which in turn drives an electrical current in any available conductor.24
During a geomagnetic storm, the interaction between the CME and Earth’s magnetosphere creates intense, fluctuating electrical currents in the ionosphere and magnetosphere. These currents generate their own powerful magnetic fields, which cause rapid and large-scale variations in the geomagnetic field at the Earth’s surface.27 This planetary-scale changing magnetic field induces a powerful, low-frequency electric field across the Earth’s crust, with magnitudes that can reach several volts per kilometer (V/km) during a severe storm.25
The modern electric power grid, with its thousands of miles of long, interconnected high-voltage transmission lines, acts as a vast continental-scale antenna, perfectly designed to collect the energy from this induced geoelectric field.24 This creates a quasi-direct current (quasi-DC) that flows along the transmission lines. This GIC seeks the path of least resistance to ground, which it finds through the grounding connections of large power transformers at electrical substations.28
This is the critical point of failure. Power transformers are the workhorses of the grid, designed to operate with high-voltage alternating current (AC) at a frequency of 60 Hz. They are not designed to handle the influx of quasi-DC from a GIC.24 The DC-like current effectively pushes the transformer’s magnetic core into a state known as half-cycle saturation.25
The consequences of core saturation are severe and multifaceted:
- Extreme Overheating: The saturated core can no longer contain the magnetic flux, which leaks into the transformer’s structural components. This creates powerful “eddy currents” that can rapidly heat steel supports and windings to the point of melting, causing permanent and catastrophic damage to the transformer.26
- Harmonic Generation: The distorted magnetic field in the saturated core injects strong harmonic frequencies into the AC power waveform. These harmonics can confuse and trigger protective relays elsewhere in the grid, causing them to trip and disconnect healthy lines or generators, potentially leading to a cascading system collapse.26
- Increased Reactive Power Demand: Saturated transformers draw a large amount of reactive power from the grid to support their magnetic fields. This sudden, massive demand for reactive power can destabilize grid voltage over a wide area, leading to a voltage collapse and a regional blackout.25
Ionospheric Disturbance: The Crippling of GPS and High-Frequency (HF) Communications
While GICs attack the grid from the ground up, solar storms also attack critical systems from the sky down by disrupting the ionosphere, the layer of charged particles in the upper atmosphere from roughly 90 to 1000 km in altitude.32
Radio Blackouts: The initial flash of X-ray and EUV radiation from a solar flare arrives at Earth in just over eight minutes. This intense energy is absorbed by the lowest layer of the ionosphere, the D-region, causing a sudden and dramatic increase in its ionization and density. Under normal conditions, HF radio waves (3-30 MHz) used for long-distance communication (e.g., by aircraft on transoceanic routes, emergency services, and military) are refracted off the upper layers of the ionosphere to travel beyond the horizon. However, the newly densified D-layer acts like a sponge, absorbing the HF radio waves instead of reflecting them. This results in a complete loss of HF communications—a radio blackout—on the entire sunlit side of the Earth, lasting from minutes to hours depending on the flare’s intensity.8
GPS Signal Degradation: The Global Positioning System (GPS) is fundamentally dependent on the stable and predictable travel of radio signals from satellites to ground receivers. These signals must pass through the ionosphere. A geomagnetic storm injects enormous energy into the upper atmosphere, heating and disturbing the ionosphere and dramatically increasing its Total Electron Content (TEC)—the total number of electrons in a column between the satellite and the receiver.34 This super-charged ionosphere acts like a distorted lens, bending and slowing the GPS signal in unpredictable ways. GPS receivers contain models to correct for the average ionospheric delay, but these models are overwhelmed by storm-time conditions. The result is a significant degradation in positioning accuracy, with errors increasing from a baseline of a few meters to tens of meters or more.32
In the most severe cases, particularly in equatorial and polar regions, the storm creates small-scale, intense irregularities in the ionospheric plasma. These irregularities cause the GPS signal to fluctuate rapidly in amplitude and phase, a phenomenon known as “scintillation”.32 This is analogous to the twinkling of starlight as it passes through atmospheric turbulence. For a GPS receiver, this scintillation can make it impossible to maintain a lock on the satellite’s signal, resulting in a total loss of service. This affects even advanced dual-frequency military and civilian receivers that are designed to correct for ionospheric delay.34
Direct Particle Effects: The Danger to Satellites and High-Altitude Aviation
The third major disruption mechanism involves the direct impact of high-energy particles, primarily from solar radiation storms (S-Scale events), on space-based assets and high-altitude vehicles.
Radiation Damage to Satellites: Satellites operating outside the protection of Earth’s atmosphere are directly exposed to streams of energetic protons and electrons. These particles can penetrate deep into the satellite’s interior, wreaking havoc on sensitive microelectronics.38 The damage occurs in several ways:
- Total Ionizing Dose (TID): This is the cumulative effect of radiation over the lifetime of a mission, gradually degrading the performance of electronic components until they fail.40
- Displacement Damage: Energetic particles can physically knock atoms out of their crystal lattice structure in semiconductors, causing cumulative damage that degrades device performance.40
- Single Event Effects (SEEs): This is an immediate effect caused by a single high-energy particle striking a critical node in a microchip. An SEE can cause a non-destructive “bit flip” in memory (a Single Event Upset, or SEU), which can lead to software glitches or phantom commands. More seriously, it can trigger a high-current state known as a “latch-up” that can require a full power cycle to clear, or it can cause a catastrophic failure like a burnout or gate rupture.40
Satellite Charging: The flux of charged particles can also cause different parts of a satellite’s surface to build up a static charge at different rates. When the voltage potential between these surfaces becomes too great, an electrostatic discharge—essentially a miniature lightning strike—can occur. This arc can damage surface materials or induce a current that destroys sensitive internal electronics.24
Atmospheric Drag: For satellites in Low-Earth Orbit (LEO), such as the International Space Station and many imaging and communications constellations, a geomagnetic storm poses an additional threat. The energy deposited in the upper atmosphere causes the thermosphere to heat up and expand dramatically. This increases the atmospheric density at orbital altitudes, which in turn increases the frictional drag on satellites. This increased drag slows the satellite down, causing its orbit to decay faster than predicted. This can make tracking satellites difficult, complicates collision avoidance maneuvers, and can shorten the operational lifetime of the satellite.2
Aviation and Astronaut Risk: The same energetic particles that damage satellites pose a radiation risk to humans in space and at high altitudes. During a severe solar radiation storm, astronauts on an extravehicular activity (EVA) would be exposed to potentially lethal doses of radiation.18 Passengers and crew on commercial aircraft flying polar routes, which are less protected by Earth’s magnetic field, are also exposed to elevated radiation levels, often forcing airlines to reroute these flights at significant cost.13
The mechanisms of disruption highlight a critical duality in the space weather threat. The danger to ground-based infrastructure, primarily the electric grid, is a conducted threat, where GICs physically flow through wires. Mitigation, therefore, involves physical hardware solutions like blocking devices and operational procedures to manage current flows. In contrast, the danger to space-based assets and communications is a radiated threat, involving the propagation of electromagnetic waves and energetic particles through space and the atmosphere. Mitigation for these systems relies on component hardening, shielding, software redundancy, and advanced signal processing. A comprehensive national resilience strategy must therefore be bifurcated, addressing these two fundamentally different physical threat vectors with distinct and tailored sets of countermeasures.
Furthermore, the widespread disruption of GPS reveals a deeper, more systemic vulnerability. The public largely perceives GPS as a navigation utility for getting directions. In reality, its most critical function for modern infrastructure is as a source of Positioning, Navigation, and Timing (PNT).43 The precise timing signals from GPS satellites act as a global master clock, synchronizing the world’s digital infrastructure. The loss of this timing signal would desynchronize cellular networks, preventing call handoffs; halt high-frequency trading and invalidate financial transactions; and disrupt the sequencing of industrial control systems in power plants, pipelines, and manufacturing facilities.44 This transforms the impact of a GPS outage from a navigational inconvenience into a foundational failure of the entire digital economy, a far more catastrophic outcome than is commonly understood.
III. Global Vulnerabilities and Systemic Risks
While the physical mechanisms of disruption are universal, their impact is magnified by the structure of modern global society. The high degree of technological dependency and interconnectedness that powers the global economy also makes it exceptionally vulnerable to a systemic shock like a severe geomagnetic storm. Historical events provide a stark benchmark for the potential consequences.
A World Wired for Failure: Interconnectedness of Global Infrastructure
Modern civilization is a complex, tightly coupled “system of systems.” Critical infrastructures such as energy, communications, finance, transportation, and water are no longer independent sectors but are deeply intertwined and mutually dependent.48 At the base of this pyramid lies the electric power grid. The loss of electrical power for a prolonged period does not simply remove one service; it triggers a cascading failure that brings all other critical functions to a halt.9
This interconnectedness globalizes the risk. A severe space weather event is one of the few natural disasters capable of simultaneously impacting multiple continents.50 Even nations not in the direct path of the storm’s most intense effects would suffer profound economic consequences. The global supply chain is a finely tuned network that relies on the constant functioning of manufacturing, shipping, and finance. A major disruption in one key economic region, such as North America or Europe, would propagate through this network, causing production halts, shipping delays, and financial turmoil worldwide.51 A study led by the University of Cambridge found that in a scenario where a blackout affects two-thirds of the U.S. population, the daily domestic economic loss could total $41.5 billion, with an additional $7 billion in daily losses occurring through disruptions to the international supply chain.53
Historical Precedents: Benchmarking the Threat
To understand the potential impact of a future event, it is essential to analyze past occurrences. Two events in particular serve as critical benchmarks: the 1859 Carrington Event, representing the worst-case scenario in recorded history, and the 1989 Quebec Blackout, representing a modern, tangible example of grid failure.
The 1859 Carrington Event
The geomagnetic storm of September 1-2, 1859, remains the most intense on record and is the definitive benchmark for an extreme space weather event.1 It was caused by a major solar flare and an exceptionally fast CME that reached Earth in just 17.6 hours.
The event produced stunning auroral displays that were seen across the globe, from the poles to equatorial regions like Cuba, Hawaii, and Colombia.23 The light was so brilliant that people in the northeastern United States could read newspapers at night, and gold miners in the Rocky Mountains were woken up, believing it was morning.23
The most significant impact was on the high technology of the era: the global telegraph network. The GICs induced by the storm were so powerful that they wreaked havoc on the system.1 Telegraph pylons threw sparks, operators received electric shocks, and in some cases, the surges set telegraph paper on fire.23 In a now-famous exchange, operators between Boston and Portland found that the induced current was so strong and stable that they could disconnect their batteries and continue to send and receive messages for two hours, powered solely by the storm itself.23 While a curiosity in 1859, this event demonstrated the immense power that a geomagnetic storm could inject into a continental-scale electrical conductor. A storm of this magnitude today would have a devastating impact, with a 2013 Lloyd’s of London report estimating the potential economic cost to the U.S. alone at $0.6 to $2.6 trillion.1
The 1989 Quebec Blackout
On March 13, 1989, a severe geomagnetic storm, though significantly weaker than the Carrington Event, provided a stark wake-up call to the modern power industry.2 The storm induced powerful GICs in the long transmission lines of the Hydro-Québec power grid.55
The influx of GICs caused a cascade of protective relays to trip across the system. In less than 90 seconds, the entire Quebec grid collapsed, plunging six million people into darkness for more than nine hours.27 The event was not isolated to Canada. Across the United States, the storm caused over 200 power grid anomalies from coast to coast and led to the permanent destruction of a large GSU (Generator Step-Up) transformer at the Salem Nuclear Power Plant in New Jersey.2 The 1989 storm was a clear demonstration of the modern grid’s vulnerability to space weather and became the archetypal event driving much of the subsequent research and mitigation efforts.56
While the Carrington Event is the accepted benchmark for a 1-in-150-year storm, it is crucial to recognize that it may not represent the true worst-case scenario. Analysis of cosmogenic isotopes like Carbon-14 in tree rings and Beryllium-10 in ice cores has revealed evidence of past solar energetic particle events that dwarf Carrington in magnitude. The event of 774–775 AD, for example, is estimated to have been an order of magnitude more powerful.23 This paleoclimatological evidence suggests that the Sun is capable of producing “superflares” far beyond what has been observed in the modern instrumental era.
Basing national resilience standards solely on surviving a Carrington-level event may, therefore, be dangerously insufficient. Strategic planning must account for the low-probability but catastrophic possibility of a “Miyake-class” event, which could overwhelm even hardened systems and would require a fundamentally different level of societal preparedness.
One area of surprising resilience appears to be the physical backbone of the global internet: the network of undersea fiber-optic cables. Initial concerns focused on the vulnerability of the electrically powered repeaters—devices spaced along the cables to boost the optical signal—to GICs.58 However, recent empirical studies, including analysis by Google of its own transoceanic cables, have shown that these systems are robustly engineered.60 The power feeding equipment at the cable landing stations has significant voltage headroom, and the dual-ended power design allows the system to compensate for induced voltage fluctuations.59 An extrapolation from observed data suggests that a Carrington-level storm would induce a voltage increase of around 800 Volts, well within the typical 6,000-Volt tolerance of modern systems.60 Furthermore, the low electrical resistivity of seawater effectively shields the deeply submerged portions of the cables from the geoelectric field.59
This finding fundamentally shifts the threat model for the internet. The primary risk is not the simultaneous destruction of the undersea cables, which would take years to replace. Instead, the threat is the widespread, long-duration failure of the terrestrial power grids that supply electricity to the cable landing stations, data centers, and end-users.59 This would lead to a scenario of “internet partitioning,” where the global backbone remains largely intact but continents and regions become digital islands, unable to connect to it. The recovery challenge is thus transformed from a multi-year global cable-laying effort to a regional power restoration effort—a problem that is still immense, but fundamentally different in nature.
IV. A Nation at Risk: Detailed Impact Analysis for the United States
The United States, with its vast, technologically advanced, and highly interconnected economy, is uniquely vulnerable to the effects of a severe geomagnetic storm. The impact would not be a single, isolated disaster but a cascading systemic failure, originating with the electric grid and propagating through every sector of society.
The Electric Grid: The Nation’s Achilles’ Heel
The U.S. electric grid is the foundational infrastructure upon which all other critical functions depend. Its inherent design and specific geographic vulnerabilities make it the nation’s primary point of failure in a severe space weather event.
Structure and Susceptibility: The bulk power system in the contiguous United States is composed of three large, asynchronous interconnections: the Eastern Interconnection, the Western Interconnection, and the Texas Interconnection.28 This network includes over 180,000 miles of high-voltage transmission lines, with a growing number of extra-high voltage (EHV) lines (345 kV and above) spanning great distances.28 These long conductors are exceptionally efficient at collecting geomagnetically induced currents, making the grid highly susceptible to large-scale induction during a storm.28
Transformer Vulnerability and Replacement Crisis: The most acute vulnerability lies with the large EHV power transformers that are the backbone of the transmission system. As detailed previously, GICs can cause these transformers to suffer from rapid, intense internal heating and damaging harmonics, leading to mis-operation, tripping, or permanent physical destruction.26 A severe storm could damage or destroy a significant number of these critical assets across a wide geographic area simultaneously.1 This presents an unprecedented recovery challenge. EHV transformers are not off-the-shelf products; they are massive, custom-built pieces of equipment that cost millions of dollars each. Crucially, they have manufacturing and delivery lead times of 1 to 2 years or longer under normal conditions.1
In a post-storm scenario with dozens or hundreds of transformers needing replacement, global manufacturing capacity would be overwhelmed, extending these timelines even further. The United States currently maintains a very small inventory of spare EHV transformers, sufficient to cover less than 10% of the installed base, making rapid replacement impossible.2 A Lloyd’s of London study projected that a Carrington-level event could leave 20-40 million Americans without power for a period ranging from 16 days to 1-2 years, with the duration dictated almost entirely by transformer availability.1
Geological High-Risk Zones: The vulnerability of the grid is not uniform across the country. It is significantly amplified by the underlying geology. The magnitude of the geoelectric field induced at the surface is inversely proportional to the conductivity of the Earth’s crust. In regions with highly conductive geology (e.g., sedimentary basins), the induced currents can flow easily through the ground. However, in areas with electrically resistive geology, such as ancient igneous rock formations, the ground impedes the flow of these currents. As a result, the currents are shunted into the man-made conductors of the power grid, which offer a path of lower resistance.46
The U.S. Geological Survey (USGS) has produced geoelectric hazard maps that identify these high-risk areas.62 The maps show elevated hazard levels across the northern Midwest and, most critically, along the Piedmont geologic formation, which runs east of the Appalachian Mountains. This region of high geological risk is directly adjacent to some of the nation’s most densely populated and economically vital areas, including the metropolitan corridors of Atlanta, Washington D.C., Philadelphia, New York City, and Boston.62 This creates a dangerous strategic vulnerability: the nation’s primary centers of finance, government, and commerce are situated in a zone that is geologically predisposed to experiencing the most severe impacts from a geomagnetic storm.
The PNT Dependency Crisis: Life Without GPS
The second foundational vulnerability, equal in systemic importance to the grid, is the nation’s overwhelming dependence on the Global Positioning System (GPS) for Positioning, Navigation, and Timing (PNT) services. The Cybersecurity and Infrastructure Security Agency (CISA) has identified this dependency as a critical national risk, as nearly all 16 critical infrastructure sectors rely on GPS as a primary, and in many cases sole, source of PNT.43
A severe solar storm would degrade or deny GPS service through intense ionospheric disturbances, as previously described. The consequences would extend far beyond the loss of navigation:
- Communications Collapse: Modern digital communications networks, especially cellular systems, depend on GPS timing signals with microsecond accuracy to synchronize the operation of base stations and manage the handoff of calls and data packets between cells. Without this timing reference, the networks would quickly become desynchronized and collapse.44
- Financial Market Freeze: The financial services sector requires precise, verifiable timestamps for all transactions, a function provided by GPS. High-frequency trading algorithms, which execute millions of trades per second, are entirely dependent on this timing. The loss of PNT would halt the functioning of modern stock exchanges, banking systems, and all forms of electronic commerce.44
- Industrial Control System Failure: Supervisory Control and Data Acquisition (SCADA) systems and other industrial controls across the energy, water, and manufacturing sectors use GPS timing to synchronize operations and monitor system states. For example, synchrophasors on the electric grid use GPS timing to provide a real-time snapshot of grid stability. The loss of this timing source would cripple the ability to monitor and control these complex systems.46
- Paralysis of Emergency and Military Operations: The U.S. military is heavily dependent on GPS for virtually all aspects of modern warfare, including navigation, targeting, and communications.2 Civilian emergency responders would likewise lose a primary tool for navigation and asset tracking at the very moment a widespread disaster unfolds.63
Cascading Infrastructure Collapse
The failure of the electric grid and the loss of PNT services would not be isolated events. They would be the twin triggers for a rapid, cascading collapse of all other interdependent infrastructures, leading to a societal breakdown on a scale difficult to comprehend.
Table 2: Cascading Failure Matrix for U.S. Critical Infrastructure
| Sector | T+1 Hour | T+24 Hours | T+72 Hours | T+1 Week |
| Energy (Grid) | Widespread blackouts; voltage instability; potential transformer damage. | Blackout area stabilizes; damage assessment begins; GIC threat subsides. | Grid remains down in affected areas; initial repair efforts hampered by fuel/transport loss. | No significant restoration; awaiting transformer replacements. |
| PNT (GPS) | Severe degradation/loss of lock in affected regions due to ionospheric storm. | Signal accuracy slowly improves as ionosphere stabilizes. | PNT services largely restored, but ground-based user equipment lacks power. | PNT network functional, but useless for a population without power. |
| Communications | Cellular networks fail due to loss of power and timing; landlines fail. | Backup power at cell towers begins to fail; emergency radio overloaded. | Most backup generators at comms hubs run out of fuel; widespread silence. | Complete communication blackout in affected regions. |
| Water | Water pumps fail; loss of water pressure in many areas. | Water towers empty; water supply ceases for millions. | Wastewater treatment plants fail; risk of sewage contamination of water sources. | Severe public health crisis from lack of sanitation and potable water. |
| Fuel | Gas station pumps inoperable; pipeline pumps shut down. | Fuel distribution halts completely. | Backup generators at critical facilities begin to run out of fuel. | No fuel available for transportation, emergency services, or generators. |
| Transportation | Traffic light failures cause gridlock; loss of GPS disrupts aviation/shipping. | Airports close; public transit stops; roads become impassable with stalled vehicles. | Inability to refuel paralyzes all transportation, including emergency and repair vehicles. | Affected region is isolated; no movement of goods or people. |
| Healthcare | Hospitals switch to backup generators. | Hospitals operate on limited power; begin to face supply shortages. | Hospital backup generators fail as fuel runs out; patient care collapses. | Catastrophic failure of healthcare system; mass casualties. |
| Finance | Electronic transactions halt; ATMs inoperable. | Financial markets closed; banking system frozen. | Inability to access money leads to breakdown of commerce. | Barter economy may emerge; loss of confidence in financial system. |
| Food | Refrigerated supply chain begins to fail. | Widespread food spoilage in stores and warehouses. | Household food supplies begin to run out; grocery stores empty and unsupplied. | Severe food shortages and starvation become a major threat. |
This timeline reveals a critical insight: the most dangerous feedback loop is the “refueling crisis.” The failure of the electric grid immediately halts the liquid fuel distribution system.66 This, in turn, prevents the refueling of backup generators at essential facilities like hospitals, communication hubs, and water treatment plants, which typically have only 24-72 hours of fuel on-site.66 It also paralyzes the transportation network, making it impossible for repair crews to reach damaged grid components or for new equipment, like transformers, to be delivered. This circular dependency—grid restoration requires fuel, but fuel distribution requires the grid—is the mechanism that could lock a region into a multi-month or multi-year blackout, transforming a manageable disaster into a societal catastrophe.
V. National Preparedness Assessment: Capabilities and Deficiencies
The United States has formally recognized the threat of extreme space weather and has established a national policy framework to address it. However, a critical examination reveals a significant gap between these strategic plans and the nation’s actual operational readiness and infrastructure resilience.
Current Framework: The National Space Weather Strategy and Action Plan
The primary policy document guiding U.S. efforts is the National Space Weather Strategy and Action Plan, most recently updated in 2019.67 This strategy is coordinated by the Space Weather Operations, Research, and Mitigation (SWORM) Working Group under the White House Office of Science and Technology Policy (OSTP).67 The plan sets forth three key objectives:
- Enhance the protection of national assets and operations against the effects of space weather.
- Develop and disseminate accurate and timely space weather characterization and forecasts.
- Establish plans and procedures for responding to and recovering from space weather events.68
This framework is supported by legislation, such as the Promoting Research and Observations of Space Weather to Improve the Forecasting of Tomorrow (PROSWIFT) Act, and by Presidential Executive Orders, which codify the roles and responsibilities of federal agencies like NOAA, NASA, DHS, and DOE.69 This indicates that, at the highest levels of government, the threat is acknowledged and a formal structure for addressing it is in place.
Monitoring and Forecasting: The Role and Limitations of NOAA’s SWPC
The operational heart of the nation’s space weather readiness is NOAA’s Space Weather Prediction Center (SWPC) in Boulder, Colorado.71 The SWPC serves as the official national and international warning center, operating 24/7 to monitor the Sun and forecast its activity.71
Capabilities: The SWPC utilizes a vast array of data from ground-based observatories and a fleet of space-based satellites, including the GOES series and the DSCOVR spacecraft at the L1 point.72 Its forecasters use this data to run sophisticated models, such as the WSA-Enlil model, which simulates the propagation of CMEs through the heliosphere to predict their arrival time and potential impact at Earth.74 The SWPC issues a continuous stream of products, including alerts, watches, and warnings based on the NOAA Space Weather Scales, which are disseminated to government agencies, critical infrastructure operators, and the public.72
Limitations: Despite these advanced capabilities, space weather forecasting remains an inexact science. The most significant limitations are the short warning times and the uncertainty in predicting the precise characteristics of an Earth-directed CME. While the launch of a CME can be observed, providing a one to three-day heads-up, the most critical parameter—the orientation of its magnetic field (Bz)—cannot be accurately determined until it is directly measured by a satellite at the L1 point.11 This provides a final, high-confidence warning of only 15 to 60 minutes before the storm’s impact on the magnetosphere.11 This extremely short window for final confirmation places immense pressure on decision-makers and infrastructure operators to act on forecasts that carry a significant degree of uncertainty.
Regulatory Landscape: NERC Standards and Grid Operator Requirements
To translate federal policy into action for the electric power industry, the Federal Energy Regulatory Commission (FERC) has directed the North American Electric Reliability Corporation (NERC) to develop and enforce mandatory reliability standards related to geomagnetic disturbances.55
- EOP-010-1 (Geomagnetic Disturbance Operations): This standard requires Reliability Coordinators and Transmission Operators to have formal GMD operating plans.78 These plans detail the procedures for receiving space weather information from the SWPC and taking operational actions to posture the system for a storm, such as canceling planned maintenance, reducing power transfers on vulnerable lines, and ensuring sufficient reactive power reserves are online.79 This standard focuses on real-time operational mitigation.
- TPL-007-4 (Transmission System Planned Performance for GMD Events): This standard addresses long-term planning. It requires applicable utilities to perform a GMD Vulnerability Assessment of their systems at least once every five years.79 This assessment involves modeling the impact of a defined “benchmark” GMD event to calculate the expected GIC flows. If the assessment reveals that the system would experience voltage collapse or cascading failures, or that specific transformers would be subject to thermal damage (triggered by a calculated GIC of 75 Amperes per phase or greater), the utility must develop a Corrective Action Plan.81
Identified Gaps: Insights from National Exercises and GAO Reports
Despite the existence of a national strategy and regulatory standards, significant deficiencies in U.S. preparedness remain. The core issue appears to be a disconnect between policy and planning on one hand, and investment and operational reality on the other.
This gap is best described as a “preparedness paradox.” The formal existence of strategies like the SWORM Action Plan and regulations like NERC’s TPL-007 creates a veneer of preparedness, suggesting the threat is being managed. However, other evidence points to a lack of deep institutional conviction in the probability and severity of a Carrington-class event. A 2018 Government Accountability Office (GAO) report highlighted that there are still “differing views on the scale and extent” of the risk within the industry and government.82 This uncertainty, coupled with the high upfront cost of physical mitigation, leads to a preference for procedural solutions over infrastructure hardening, and a general institutional inertia.83 The problem is often treated as a matter of regulatory compliance rather than a response to an existential threat.
This paradox was starkly illustrated by the first-ever national end-to-end space weather exercise held in May 2024. The exercise, which simulated a severe storm scenario, revealed “significant gaps in preparedness” and “significant weaknesses” in the nation’s ability to mount a coordinated response.3 Key deficiencies identified included the need for faster decision-making frameworks to cope with short warning times and a lack of effective information sharing and public messaging protocols.3 The exercise demonstrated that the plans on paper did not translate into effective, coordinated action under pressure.
Furthermore, the regulatory framework itself may be creating a false sense of security. The NERC TPL-007 standard requires utilities to assess their systems against a benchmark GMD event that represents a 1-in-100-year storm.77 However, the 1859 Carrington Event is considered a 1-in-150-year storm, and as noted previously, paleoclimatological data points to the existence of “Miyake-class” superflares that were an order of magnitude more powerful.23 Therefore, a utility that is fully compliant with the current NERC standard may still be vulnerable to a true worst-case event. The standard may be preparing the grid to withstand a Category 3 hurricane while the credible threat includes a Category 5 or even a meteor strike. This suggests the regulatory benchmark itself is insufficient and needs to be re-evaluated based on a more complete understanding of the long-term solar record.
Finally, the deployment of proven GIC mitigation technologies remains minimal. While the GAO report acknowledged the existence of technologies like neutral blocking devices and GIC-resistant transformer designs, it noted that they have not been widely deployed.82 The first installation of a neutral blocking device on the U.S. bulk power system by the Western Area Power Administration (WAPA) was a pilot program that only went online in late 2022.84 The nation’s grid remains, for the most part, physically unhardened against the GIC threat.
VI. Strategic Recommendations for National Resilience
The analysis of the space weather threat and the current state of U.S. preparedness indicates an urgent need for a more robust and proactive national strategy. The following recommendations are organized by domain—Policy, Technology, and Response—and are designed to transform the nation’s posture from one of procedural compliance to one of genuine resilience.
Policy and Governance
- Elevate Extreme Space Weather to a Tier 1 National Security Threat: The White House National Security Council should formally designate a Carrington-class geomagnetic storm as a Tier 1 national security threat, placing it on par with threats such as a major cyberattack, a large-scale pandemic, or the use of a weapon of mass destruction. This designation is critical to overcome institutional inertia and unlock the sustained political will and federal funding necessary for a whole-of-government and national effort.
- Mandate and Fund Hardening of Critical Grid Infrastructure: Congress should grant the Federal Energy Regulatory Commission (FERC) explicit authority to mandate the physical hardening of the bulk electric system against a severe GMD event. This should move beyond the current assessment-based NERC standards to require the installation of proven GIC mitigation hardware (e.g., neutral blocking devices, series capacitors) on all EHV transformers, particularly those located in the geologically high-risk zones identified by the USGS. To facilitate this, a federal cost-sharing program or significant tax incentives should be established to offset the capital investment for utility companies.
- Update NERC Reliability Standards to a More Realistic Threat Benchmark: FERC should direct NERC to immediately begin the process of revising Reliability Standard TPL-007. The new standard’s benchmark GMD event should not be based on a 1-in-100-year model but on a more extreme, Carrington-plus scenario that incorporates the best available scientific evidence, including data from paleoclimatological studies of past superflares. The standard must drive the industry to prepare for the plausible worst-case, not a median severe event.
Technology and Infrastructure
- Establish a Strategic Transformer Reserve (STR): Congress should authorize and fund the Department of Energy (DOE) to establish a national strategic reserve of EHV transformers and other critical long-lead-time grid components. This is the single most important action to mitigate the risk of a multi-year blackout. The STR would act as a national insurance policy, ensuring that replacement transformers could be delivered to affected regions in a matter of weeks, not years. The program should include standardized designs to improve interoperability and a logistics plan for transporting and installing these massive components under crisis conditions.
- Accelerate Deployment and Manufacturing of GIC Mitigation Technologies: The DOE, in partnership with the private sector, should launch a national program to scale up the domestic manufacturing and accelerate the deployment of GIC mitigation technologies. This initiative would reduce reliance on foreign supply chains for critical components and create a streamlined process for utilities to procure and install protective hardware like neutral blocking devices.83
- Build Redundancy into National PNT Services: The Department of Transportation, DHS, and Department of Commerce must lead an aggressive national effort to develop and deploy systems that can provide alternative PNT services, breaking the nation’s critical dependency on GPS. This should include expanding access to NIST’s high-accuracy fiber-optic time service for critical infrastructure sectors like finance and energy, promoting the development of terrestrial broadcast systems (such as enhanced Loran), and exploring the utility of commercial LEO satellite constellations for resilient PNT.45
Forecasting and Response
- Invest in Next-Generation Space Weather Observation Assets: Congress should fully fund NASA and NOAA’s next-generation space weather satellite programs, including missions that would place observational assets at locations other than the L1 point (e.g., a “side-looking” observatory). Multiple vantage points would provide a more three-dimensional view of CMEs as they leave the Sun, dramatically improving the accuracy of trajectory and impact forecasts and potentially extending reliable warning times.
- Overhaul National Response Protocols and Conduct Mandatory Exercises: DHS and FEMA, using the critical lessons learned from the May 2024 tabletop exercise, must lead a comprehensive overhaul of the national space weather response plan.3 The new plan must establish clear, streamlined command-and-control structures and decision-making authorities that can function effectively within the short warning windows. Regular, mandatory, and realistic national-level exercises involving all relevant federal, state, local, and private sector entities must be conducted to test and refine these protocols.
- Launch a National Public Awareness and Preparedness Campaign: FEMA and Ready.gov should develop and launch a sustained public education campaign focused on the specific threat of a long-duration blackout from a solar storm. This campaign, modeled on successful programs like “The Great ShakeOut” for earthquakes, should inform citizens about the unique challenges of such an event and provide clear, actionable guidance on how to prepare for extended self-sufficiency.
Table 3: Multi-Layered Resilience Strategy
| Actor | Pre-Event Hardening & Planning | During-Event Operations |
| Federal Government | Mandate and fund grid hardening. Establish Strategic Transformer Reserve. Fund GPS-alternative PNT. Update NERC benchmark. Invest in forecasting assets. | Disseminate clear, actionable warnings via SWPC. Activate national response plans (FEMA). Coordinate federal agency actions. Provide situational awareness to states. |
| State/Local Government | Integrate long-duration blackout scenarios into state emergency plans. Identify critical facilities for priority power restoration. Promote community resilience programs. | Activate Emergency Operations Centers. Disseminate federal warnings to the public. Manage local first responder resources. Establish warming/cooling centers. |
| Critical Infrastructure Operators | Install GIC blocking devices. Procure backup transformers. Develop GPS-independent timing sources. Conduct vulnerability assessments against extreme benchmark. Stockpile spare parts. | Implement GMD Operating Procedures (e.g., reduce grid load). Disconnect sensitive equipment. Switch to backup power and timing systems. Communicate status to government partners. |
| Individuals / Communities | Build a 2-week+ emergency kit (water, food, medicine). Create a non-electric communication plan. Maintain a supply of cash. Keep vehicles fueled. Develop community-level resource plans. | Follow official instructions (EAS, NOAA radio). Conserve power and water. Check on neighbors. Implement family communication plan. Avoid non-essential travel. |
VII. Citizen and Community Preparedness
While national and industry-level strategies are essential for mitigating the impact of a severe solar storm, individual and community preparedness forms the ultimate foundation of societal resilience. A Carrington-class event would not be a typical power outage lasting a few hours or days; it could result in a prolonged grid-down scenario where essential services—water, fuel, communications, banking, and emergency response—are unavailable for weeks or even months.66 In such a scenario, self-sufficiency and community cooperation will be paramount.
Understanding the Personal Risk: Beyond a Typical Power Outage
The primary challenge for citizen preparedness is a conceptual one: understanding that the failure of the electric grid means the failure of nearly everything else. The immediate consequences include:
- No Water: Municipal water pumps will stop, and water pressure will be lost. Clean drinking water will not be available from the tap.66
- No Fuel: Gas stations cannot pump fuel without electricity. The ability to travel or run personal generators will be severely limited.66
- No Communications: Cell phones, landlines, and the internet will fail. Access to information and the ability to call for help will be restricted to battery-powered radios.66
- No Money: ATMs and credit card systems will be inoperable. Commerce will revert to cash or barter.66
- No Food Resupply: The “just-in-time” food supply chain will break down. Grocery stores will be unable to restock, and existing perishable food will spoil quickly.66
Actionable Steps for Individuals and Families
Guidance from federal agencies like FEMA (Ready.gov) and organizations like the American Red Cross provides a solid foundation for preparedness, but it must be adapted for the scale and duration of a severe space weather event.87 The goal should be to achieve self-sufficiency for a minimum of two weeks.
- Build an Extended-Duration Emergency Kit: A standard 72-hour kit is insufficient. A household kit should contain:
- Water: A minimum of one gallon of water per person, per day, for at least 14 days. This is for both drinking and basic sanitation.87
- Food: At least a 14-day supply of non-perishable food that requires no cooking or refrigeration. Include a manual can opener.87
- Lighting and Communications: Multiple flashlights and/or lanterns with a large supply of extra batteries. A hand-crank or battery-powered NOAA Weather Radio is essential for receiving official information.86
- Medical Supplies: A one-month supply of all necessary prescription medications, as well as a fully stocked first-aid kit and any required medical equipment with backup power options.85
- Sanitation: Moist towelettes, garbage bags, plastic ties, and other supplies for emergency sanitation.87
- Establish a Grid-Independent Communication Plan:
- Assume that phones will not work. Create a family plan that designates a physical meeting place and an out-of-state contact person who can act as a central point of communication for separated family members.86
- Keep hard copies of important phone numbers and documents (e.g., insurance policies, identification) in a waterproof container.87
- Secure Financial and Data Resilience:
- Keep a supply of cash in small denominations. In a world without electronic payments, cash will be the only means of transaction.87
- Make offline, non-electric backups of critical personal and financial data, photos, and documents.86
- Prepare Your Home and Vehicle:
- Fuel: Keep the gas tanks of all personal vehicles at least half-full at all times.86
- Heating/Cooking: Have a safe, non-electric method for cooking, such as a camp stove or barbecue grill, and a supply of fuel. NEVER use these devices indoors due to the risk of fire and fatal carbon monoxide poisoning.88
- Power: Consider investing in a small solar-powered charger for recharging small essential devices like a radio or flashlight.86 If using a portable generator, ensure it is installed and operated safely outdoors, far from windows.88
Building Community Resilience
In a prolonged, large-scale disaster, the most effective response unit is often the local community. Individuals should be encouraged to work with their neighbors to develop community-level resilience plans. This can include:
- Mapping Local Resources: Identifying neighbors with specific skills (e.g., medical training, mechanical expertise) and local resources (e.g., natural water sources, community gardens).
- Establishing Communication Networks: Creating a plan for sharing information within the neighborhood when official channels are down.
- Cooperative Planning: Working together to check on vulnerable neighbors, such as the elderly or those with disabilities, and pooling resources for common needs.
A severe solar storm is a unique threat that challenges the very fabric of modern life. While the government and industry have the primary responsibility for hardening critical infrastructure, the resilience of the nation will ultimately depend on the preparedness and resourcefulness of its citizens and communities.
If you find this post useful, please share the link on Facebook, with your friends, etc. Your support is much appreciated and if you have any feedback, please email me at in**@*********ps.com. Please note that for links to other websites, we are only paid if there is an affiliate program such as Avantlink, Impact, Amazon and eBay and only if you purchase something. If you’d like to directly contribute towards our continued reporting, please visit our funding page.
Sources Used
- Solar Storm Risk to the North American Electric Grid – Lloyd’s, accessed September 28, 2025, https://assets.lloyds.com/assets/pdf-solar-storm-risk-to-the-north-american-electric-grid/1/pdf-Solar-Storm-Risk-to-the-North-American-Electric-Grid.pdf
- US Security Threatened by Solar Storm Impacts on Earth- and Space-Based Technologies, accessed September 28, 2025, https://www.usu.edu/cai/files/studentpaper-fraley.pdf
- First ever Solar Storm Emergency Drill showed significant … – CTIF, accessed September 28, 2025, https://ctif.org/news/first-ever-solar-storm-preparedness-drill-showed-significant-weaknesses
- Solar Storms and Flares – NASA Science, accessed September 28, 2025, https://science.nasa.gov/sun/solar-storms-and-flares/
- Coronal mass ejection – Wikipedia, accessed September 28, 2025, https://en.wikipedia.org/wiki/Coronal_mass_ejection
- X-Class: A Guide to Solar Flares – NASA Scientific Visualization Studio, accessed September 28, 2025, https://svs.gsfc.nasa.gov/10109
- What is a Solar Flare? – NASA Science, accessed September 28, 2025, https://science.nasa.gov/solar-system/what-is-a-solar-flare/
- Solar Flares (Radio Blackouts) | NOAA / NWS Space Weather Prediction Center, accessed September 28, 2025, https://www.swpc.noaa.gov/phenomena/solar-flares-radio-blackouts
- Space Weather and Safety, accessed September 28, 2025, https://www.weather.gov/safety/space
- Coronal Mass Ejections (CME) Space Weather Phenomena, accessed September 28, 2025, https://www.swpc.noaa.gov/news/coronal-mass-ejections-cme-space-weather-phenomena
- Coronal Mass Ejections | NOAA / NWS Space Weather Prediction …, accessed September 28, 2025, https://www.swpc.noaa.gov/phenomena/coronal-mass-ejections
- Solar Wind, Geomagnetic Storms, and Coronal Mass Ejections | NESDIS, accessed September 28, 2025, https://www.nesdis.noaa.gov/our-environment/solar-activity/solar-wind-geomagnetic-storms-and-coronal-mass-ejections
- ‘Sun is waking up’: NASA warns solar activity could disrupt GPS, power grids, and satellites, accessed September 28, 2025, https://timesofindia.indiatimes.com/science/sun-is-waking-up-nasa-warns-solar-activity-could-disrupt-gps-power-grids-and-satellites/articleshow/124107834.cms
- What are the different types, or classes, of flares? – Stanford Solar Center, accessed September 28, 2025, https://solar-center.stanford.edu/sid/activities/flare.html
- svs.gsfc.nasa.gov, accessed September 28, 2025, https://svs.gsfc.nasa.gov/10109#:~:text=Flares%20are%20classified%20according%20to,and%20100%20times%20a%20C.
- Solar flare classes explained: A, B, C, M and X – YouTube, accessed September 28, 2025, https://www.youtube.com/watch?v=56w_moy6klE
- Mercury A to Z: X-Class Solar Flares – Planet Pailly, accessed September 28, 2025, https://planetpailly.com/2023/04/28/mercury-a-to-z-x-class-solar-flares/
- NOAA Space Weather Scales | NOAA / NWS Space Weather …, accessed September 28, 2025, https://www.swpc.noaa.gov/noaa-scales-explanation
- NOAA Scales – SANSA Space Weather, accessed September 28, 2025, https://spaceweather.sansa.org.za/space-weather-information/definitions/noaa-scales
- Planetary K-index | NOAA / NWS Space Weather Prediction Center, accessed September 28, 2025, https://www.swpc.noaa.gov/products/planetary-k-index
- Geomagnetic Storm Scale – SANSA Space Weather, accessed September 28, 2025, https://spaceweather.sansa.org.za/space-weather-information/definitions/noaa-scales/297-geomagnetic-storm-scale
- Geomagnetic Storms | NOAA / NWS Space Weather Prediction Center, accessed September 28, 2025, https://www.swpc.noaa.gov/phenomena/geomagnetic-storms
- Carrington Event – Wikipedia, accessed September 28, 2025, https://en.wikipedia.org/wiki/Carrington_Event
- How do solar flares mess up electrical technology? : r/AskPhysics – Reddit, accessed September 28, 2025, https://www.reddit.com/r/AskPhysics/comments/1cp4bdt/how_do_solar_flares_mess_up_electrical_technology/
- Geomagnetically induced current – Wikipedia, accessed September 28, 2025, https://en.wikipedia.org/wiki/Geomagnetically_induced_current
- Electric Power Transmission | NOAA / NWS Space Weather Prediction Center, accessed September 28, 2025, https://www.swpc.noaa.gov/impacts/electric-power-transmission
- Ground Effects of Space Weather – BGS Geomagnetism, accessed September 28, 2025, https://geomag.bgs.ac.uk/education/gic.html
- Geomagnetic Storms and the US Power Grid – Space Weather Prediction Center, accessed September 28, 2025, https://www.swpc.noaa.gov/sites/default/files/images/u33/finalBoulderPresentation042611%20%281%29.pdf
- ELI5: How do solar flares have an effect on technology? : r/explainlikeimfive – Reddit, accessed September 28, 2025, https://www.reddit.com/r/explainlikeimfive/comments/17nm54p/eli5_how_do_solar_flares_have_an_effect_on/
- By what mechanism does a solar flare overload electronics? – Physics Stack Exchange, accessed September 28, 2025, https://physics.stackexchange.com/questions/551776/by-what-mechanism-does-a-solar-flare-overload-electronics
- Methodology for simulation of geomagnetically induced currents in power systems, accessed September 28, 2025, https://www.swsc-journal.org/articles/swsc/full_html/2014/01/swsc130017/swsc130017.html
- The effects of ionospheric disturbance’s on GNSS signals during solar cycle 24 – UNOOSA, accessed September 28, 2025, https://www.unoosa.org/documents/pdf/psa/activities/2022/ISWI2022/s8_08.pdf
- Ionospheric disturbances and their effects on radio communication – IET Digital Library, accessed September 28, 2025, https://digital-library.theiet.org/content/books/10.1049/pbew031e_ch9
- Space Weather and GPS Systems | NOAA / NWS Space Weather …, accessed September 28, 2025, https://www.swpc.noaa.gov/impacts/space-weather-and-gps-systems
- Ionospheric Effects on Global Positioning System Receivers – DTIC, accessed September 28, 2025, https://apps.dtic.mil/sti/tr/pdf/ADA342594.pdf
- (PDF) IONOSPHERIC INSTABILITIES AND THEIR EFFECTS ON GROUND-BASED COMMUNICATION SYSTEMS – ResearchGate, accessed September 28, 2025, https://www.researchgate.net/publication/388969914_IONOSPHERIC_INSTABILITIES_AND_THEIR_EFFECTS_ON_GROUND-BASED_COMMUNICATION_SYSTEMS
- Study of Atmospheric ‘Froth’ May Help GPS Communications | NASA Jet Propulsion Laboratory (JPL), accessed September 28, 2025, https://www.jpl.nasa.gov/news/study-of-atmospheric-froth-may-help-gps-communications/
- llis.nasa.gov, accessed September 28, 2025, https://llis.nasa.gov/lesson/824#:~:text=Radiation%20effects%20from%20these%20particles,in%20space%20vehicles%20or%20satellites.
- Space Radiation Effects on Electronic Components in Low-Earth Orbit – Llis, accessed September 28, 2025, https://llis.nasa.gov/lesson/824
- SET Education What is space Radiation?, accessed September 28, 2025, https://lws-set.gsfc.nasa.gov/space_radiation.html
- Space weather – Satellites, Radiation, Impacts | Britannica, accessed September 28, 2025, https://www.britannica.com/science/space-weather/Effects-on-satellites
- Space weather effects on technology, accessed September 28, 2025, https://www.spaceweather.gc.ca/tech/index-en.php
- Positioning, Navigation, and Timing | Cybersecurity and Infrastructure Security Agency CISA, accessed September 28, 2025, https://www.cisa.gov/topics/risk-management/positioning-navigation-and-timing
- March 6, 2025 FCC FACT SHEET∗ Promoting the Development of Positioning, Navigation, and Timing Technologies and Solutions Noti, accessed September 28, 2025, https://docs.fcc.gov/public/attachments/DOC-410031A1.pdf
- Responsible Use of Positioning, Navigation and Timing Services | NIST, accessed September 28, 2025, https://www.nist.gov/pnt
- Solar Magnetic Storm Impact on Control Systems | CISA, accessed September 28, 2025, https://www.cisa.gov/news-events/ics-advisories/icsa-11-084-01
- Building space weather resilience in the finance sector, accessed September 28, 2025, https://www.ucl.ac.uk/public-policy/sites/public_policy_redesign/files/pp_insights_research_briefing_-_space_weather_jul2016.pdf
- Cascading Failures → Term – Energy → Sustainability Directory, accessed September 28, 2025, https://energy.sustainability-directory.com/term/cascading-failures/
- Space Weather – CISA, accessed September 28, 2025, https://www.cisa.gov/space-weather
- A REPORT TO NASA’S SPACE WEATHER SCIENCE APPLICATION PROGRAM, accessed September 28, 2025, https://www.jhuapl.edu/sites/default/files/2024-02/21-04124_Space-Gap-Analysis_v13-Digital.pdf
- Climate Volatility Disrupts Global Supply Chains – Aon South Africa, accessed September 28, 2025, https://aon.co.za/insights/climate-volatility-disrupts-global-supply-chains/
- Supply chain disruptions will further exacerbate economic losses from climate change, accessed September 28, 2025, https://www.sciencedaily.com/releases/2024/03/240313135634.htm
- Solar storms could cost USA tens of billions of dollars | University of …, accessed September 28, 2025, https://www.cam.ac.uk/research/news/solar-storms-could-cost-usa-tens-of-billions-of-dollars
- The 1859 Carrington Event Was the Most Intense Geomagnetic Storm – Could it Happen Again? | Discover Magazine, accessed September 28, 2025, https://www.discovermagazine.com/the-1859-carrington-event-was-the-most-intense-geomagnetic-storm-could-it-47617
- March 1989 geomagnetic storm – Wikipedia, accessed September 28, 2025, https://en.wikipedia.org/wiki/March_1989_geomagnetic_storm
- The Great Québec Blackout | Spaceweather.com, accessed September 28, 2025, https://spaceweatherarchive.com/2021/03/12/the-great-quebec-blackout/
- In March 1989, Québec experienced a blackout caused by a solar storm – Hydro-Quebec, accessed September 28, 2025, http://www.hydroquebec.com/learning/notions-de-base/tempete-mars-1989.html
- Solar storms and submarine internet cables – ResearchGate, accessed September 28, 2025, https://www.researchgate.net/publication/365425167_Solar_storms_and_submarine_internet_cables/fulltext/637499132f4bca7fd06470bd/Solar-storms-and-submarine-internet-cables.pdf
- (PDF) Solar storms and submarine internet cables – ResearchGate, accessed September 28, 2025, https://www.researchgate.net/publication/365425167_Solar_storms_and_submarine_internet_cables
- Are internet subsea cables susceptible to solar storms | Google Cloud Blog, accessed September 28, 2025, https://cloud.google.com/blog/products/infrastructure/are-internet-subsea-cables-susceptible-to-solar-storms
- [2211.07850] Solar storms and submarine internet cables – arXiv, accessed September 28, 2025, https://arxiv.org/abs/2211.07850
- New Geoelectric Hazard Map Shows Potential Vulnerability to High …, accessed September 28, 2025, https://www.usgs.gov/news/national-news-release/new-geoelectric-hazard-map-shows-potential-vulnerability-high-voltage
- Understanding Vulnerabilities of Positioning, Navigation, and … – CISA, accessed September 28, 2025, https://www.cisa.gov/sites/default/files/2023-04/fs_positioning-navigation-timing-vulnerabilities_508.pdf
- Understanding the economic impact of space weather risks | Analysis | StrategicRISK Global, accessed September 28, 2025, https://www.strategic-risk-global.com/esg-risks/understanding-the-economic-impact-of-space-weather-risks/1419210.article
- A solar storm like the Carrington Event could knock out the Internet – Astronomy Magazine, accessed September 28, 2025, https://www.astronomy.com/science/a-large-solar-storm-could-knock-out-the-internet-and-power-grid-an-electrical-engineer-explains-how/
- The dangers of solar storms: That which gives power can also take it …, accessed September 28, 2025, https://www.earthmagazine.org/article/dangers-solar-storms-which-gives-power-can-also-take-it-away/
- National Space Weather Strategy and Action Plan | Trump White …, accessed September 28, 2025, https://trumpwhitehouse.archives.gov/wp-content/uploads/2019/03/National-Space-Weather-Strategy-and-Action-Plan-2019.pdf
- White Paper on the Implementation Status of the National Space Weather Strategy and Action Plan, accessed September 28, 2025, https://www.sworm.gov/publications/2023/2019_nswsap_ip_summary.pdf
- Space Weather: An Overview of Policy and Select U.S. Government Roles and Responsibilities | Congress.gov, accessed September 28, 2025, https://www.congress.gov/crs-product/R46049
- Space Weather Tabletop Exercise (TTX), accessed September 28, 2025, https://www.jhuapl.edu/sites/default/files/2025-04/Space-Weather-TTX-Report-Summary-v3-FINAL.pdf
- Space Weather Prediction Center – Wikipedia, accessed September 28, 2025, https://en.wikipedia.org/wiki/Space_Weather_Prediction_Center
- Space Weather FAQ (Frequently Asked Questions) | NOAA / NWS …, accessed September 28, 2025, https://www.swpc.noaa.gov/content/space-weather-faq-frequently-asked-questions
- Homepage | NOAA / NWS Space Weather Prediction Center, accessed September 28, 2025, https://www.swpc.noaa.gov/
- WSA-ENLIL Solar Wind Prediction | NOAA / NWS Space Weather Prediction Center, accessed September 28, 2025, https://www.swpc.noaa.gov/products/wsa-enlil-solar-wind-prediction
- Products and Data | NOAA / NWS Space Weather Prediction Center, accessed September 28, 2025, https://www.swpc.noaa.gov/products-and-data
- How Prepared Are We for a Rare and Powerful Solar Event?, accessed September 28, 2025, https://www.smithsonianmag.com/science-nature/how-prepared-are-we-for-a-rare-and-powerful-solar-event-180987293/
- Benchmark Geomagnetic Disturbance Event Description – NERC, accessed September 28, 2025, https://www.nerc.com/pa/stand/project201303geomagneticdisturbancemitigation/benchmark_gmd_event_aug27_clean.pdf
- EOP-010-1 — Geomagnetic Disturbance Operations – NERC, accessed September 28, 2025, https://www.nerc.com/pa/stand/reliability%20standards/eop-010-1.pdf
- Extreme Geomagnetic Disturbances Impact NERC Planning – TRC Companies, accessed September 28, 2025, https://www.trccompanies.com/insights/extreme-geomagnetic-disturbances-impact-nerc-planning/
- NERC GMD Reliability Standards, accessed September 28, 2025, https://www.swpc.noaa.gov/sites/default/files/images/u33/_KozaGMD_standards_swpc_space_weather_workshop_apr2015.pdf
- TPL-007-1 — Transmission System Planned Performance for Geomagnetic Disturbance Events – NERC, accessed September 28, 2025, https://www.nerc.com/pa/Stand/Reliability%20Standards/TPL-007-1.pdf
- Critical Infrastructure Protection: Protecting the Electric Grid from …, accessed September 28, 2025, https://www.gao.gov/products/gao-19-98
- Robert A McEntee-A1.docx – Department of Energy, accessed September 28, 2025, https://energy.gov/sites/default/files/2021-06/Robert%20A%20McEntee-A1.docx
- Protecting the grid from solar storms – Western Area Power Administration, accessed September 28, 2025, https://www.wapa.gov/protecting-the-grid-from-solar-storms/
- Space Weather | Ready.gov, accessed September 28, 2025, https://www.ready.gov/space-weather
- Before an Extreme Solar Event – National Weather Service, accessed September 28, 2025, https://www.weather.gov/safety/space-before
- Build A Kit | Ready.gov, accessed September 28, 2025, https://www.ready.gov/kit
- Power Outage Safety | American Red Cross, accessed September 28, 2025, https://www.redcross.org/get-help/how-to-prepare-for-emergencies/types-of-emergencies/power-outage.html
- Preparing for a Power Outage – California Public Utilities Commission, accessed September 28, 2025, https://www.cpuc.ca.gov/consumer-support/preparing-for-a-power-outage